

6 Strategic RevOps Frameworks to Build Forecasts, Fix GTM Gaps, and Track Growth
Most RevOps teams don’t struggle because they lack dashboards. They struggle because too much of the function is still reactive—field updates, report requests, routing fixes, and forecast cleanup—while the bigger GTM issues sit untouched.
Strategic RevOps looks different. It uses Salesforce data, process design, and planning models to improve forecast accuracy, tighten pipeline coverage, lower CAC, and protect net revenue retention. This guide breaks down six frameworks that help RevOps leaders make that shift, plus a quarterly roadmap and metric set to track progress.
[banner type="download" url="https://www.weflow.ai/content/strategic-revops-cheat-sheet" text="Strategic RevOps Cheat Sheet" subtitle="Get tactical-vs-strategic frameworks, GTM alignment criteria, and decision-making models." button="Get it free"]Strategic RevOps foundations: shift from execution to growth
The tactical trap is familiar to most RevOps leaders. Your week disappears into ad-hoc Slack requests, broken validation rules, close date cleanup, and one-off reporting for leadership. The work matters, but if that becomes the whole job, RevOps turns into a service desk for Salesforce instead of a strategic function shaping revenue outcomes.
That usually leads to two problems. First, burnout—because urgent operational work never stops. Second, GTM misalignment—because Sales, Marketing, Customer Success, and Finance each run on different definitions, different timelines, and different assumptions. Strategic RevOps fixes that by changing the time horizon, the operating model, and the questions the team asks.
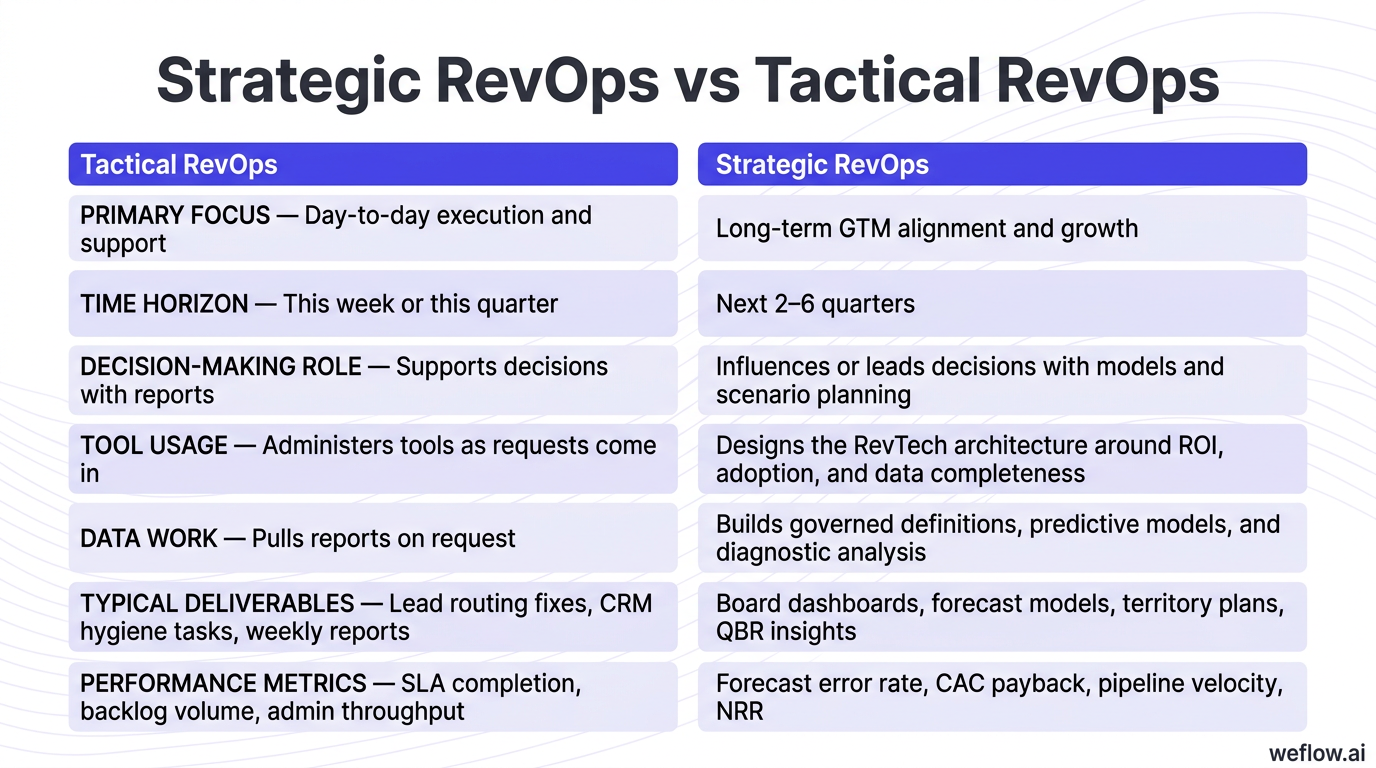
| Dimension | Tactical RevOps | Strategic RevOps |
|---|---|---|
| Primary focus | Day-to-day execution and support | Long-term GTM alignment and growth |
| Time horizon | This week or this quarter | Next 2–6 quarters |
| Decision-making role | Supports decisions with reports | Influences or leads decisions with models and scenario planning |
| Tool usage | Administers tools as requests come in | Designs the RevTech architecture around ROI, adoption, and data completeness |
| Data work | Pulls reports on request | Builds governed definitions, predictive models, and diagnostic analysis |
| Cross-functional collaboration | Works mostly with Sales | Partners with Sales, Marketing, CS, and Finance |
| Business impact | Operational efficiency | Revenue predictability, margin improvement, and better capital planning |
| Typical deliverables | Lead routing fixes, CRM hygiene tasks, weekly reports | Board dashboards, forecast models, territory plans, QBR insights |
| Performance metrics | SLA completion, backlog volume, admin throughput | Forecast error rate, CAC payback, pipeline velocity, NRR |
| Leadership perception | Operator or fixer | Strategic partner and force multiplier |
Once RevOps moves into the strategic lane, the questions change. Instead of asking, “Can we build this dashboard by Friday?” you start asking whether the revenue engine is structurally healthy.
- Revenue growth: Which segments produce the highest win rates, fastest sales cycles, and strongest retention—and how should that change capacity planning?
- Revenue growth: Where are deals slipping by stage, and is the issue qualification, pricing, multithreading, or sales manager inspection?
- Revenue growth: Are current pipeline creation and conversion rates enough to hit plan over the next two quarters?
- Operational efficiency: Which manual workflows inside Salesforce still create admin drag for reps or cleanup work for RevOps?
- Operational efficiency: Which parts of the RevTech stack have a large integration footprint but weak usage or limited reporting value?
- Operational efficiency: Are field mapping, activity sync, and Salesforce write-back rules supporting data completeness—or creating more reconciliation work?
- Market position: Which ICP segments show the best combination of ACV, payback, and retention?
- Market position: What changes in buyer behavior, competitor pressure, or product adoption should change territory design or messaging?
- Market position: Which regions, verticals, or product lines deserve more budget next planning cycle?
Assess your current RevOps maturity level
A fast self-assessment: look at your calendar from the last five working days. If most of your time went to report pulls, permission fixes, data cleanup, and reacting to leadership requests, you’re still operating tactically—even if your title says Director or VP.
| Signal | Tactical pattern | Strategic pattern |
|---|---|---|
| Decision-making influence | Brought in after GTM decisions are made | Included early in planning, forecasting, and headcount discussions |
| Data work | Manual exports, ad-hoc spreadsheet analysis, conflicting definitions | Standardized KPI logic, governed dashboards, repeatable models |
| Leadership perception | Seen as a Salesforce support function | Seen as the team that keeps board reporting and growth planning grounded in reality |
| Typical deliverables | Backlog tickets, routing fixes, report builder requests | Forecast frameworks, pipeline gap analysis, territory and capacity plans |
| Performance metrics | Ticket closure speed, admin responsiveness | Forecast accuracy, pipeline coverage, CAC payback, NRR |
| Career trajectory | Deepens as a systems operator | Expands into GTM strategy, planning, and executive influence |
Identify pitfalls blocking your strategic impact
The first step to reclaiming strategy time is to name the operational patterns that keep the team reactive. Most RevOps functions don’t need more effort. They need fewer recurring sources of noise.
| Pitfall | What it looks like in practice | Strategic shift |
|---|---|---|
| Ad-hoc overload | Constant Slack interruptions, rush dashboards, unplanned CRM changes | Set intake processes, report cadences, and protected blocks for deep work |
| Weak data strategy | Different teams define MQL, pipeline, and churn risk differently | Standardize KPI logic, field definitions, and dashboard governance in Salesforce and BI |
| Tech stack chaos | Duplicative tools, shallow integrations, weak Salesforce write-back, overlapping admin overhead | Audit tools by adoption, reporting value, and integration footprint; remove or replace low-value systems |
| Tool-first mindset | Projects framed around features instead of data completeness, forecast error rate, or rep productivity | Make every systems decision answer a business question tied to revenue or efficiency |
| Poor GTM alignment | RevOps owns systems but not planning, pricing input, or lifecycle definitions | Join planning cycles and co-own operating metrics with Sales, Marketing, CS, and Finance |
| Weak forecasting motion | Forecast calls rely on rep opinion, stale close dates, and inconsistent stage criteria | Standardize stage exit rules, forecast categories, inspection cadence, and variance analysis |
Ask high-level questions to align with GTM goals
These questions work best before quarterly planning, before QBRs, and in executive forecast syncs. If you only ask them after the quarter misses, you’re already late.
- Revenue growth
- Which customer segments are driving the best mix of win rate, ACV, and retention?
- Where are we losing deals by competitor, persona, and stage?
- What signals show churn risk early enough for CS and Sales to act?
- Are our current pipeline creation rates enough to support next quarter’s commit?
- Operational efficiency
- Which workflows still require manual data entry, spreadsheet reconciliation, or exception handling?
- What is the actual ROI of each major RevTech system once adoption, maintenance effort, and reporting value are included?
- Where are validation rules, activity sync logic, or approval paths slowing reps down without improving data quality?
- Market position
- Which ICP definitions are still based on assumptions instead of retention, sales velocity, and expansion data?
- Which regions or verticals justify added capacity based on historical productivity?
- How should pricing, packaging, or sales motion change based on buyer behavior in the last two quarters?
Six RevOps frameworks: optimize your entire revenue engine
These six frameworks work as one system. Revenue intelligence tells you where the funnel is breaking. Forecasting translates that into an expected revenue outcome. GTM optimization changes who you target and how work gets routed. Customer lifecycle management keeps post-sale data inside Salesforce so retention and expansion are visible. Sales process engineering enforces the rules that keep pipeline data usable. Annual planning connects all of it to headcount, budget, and board expectations.
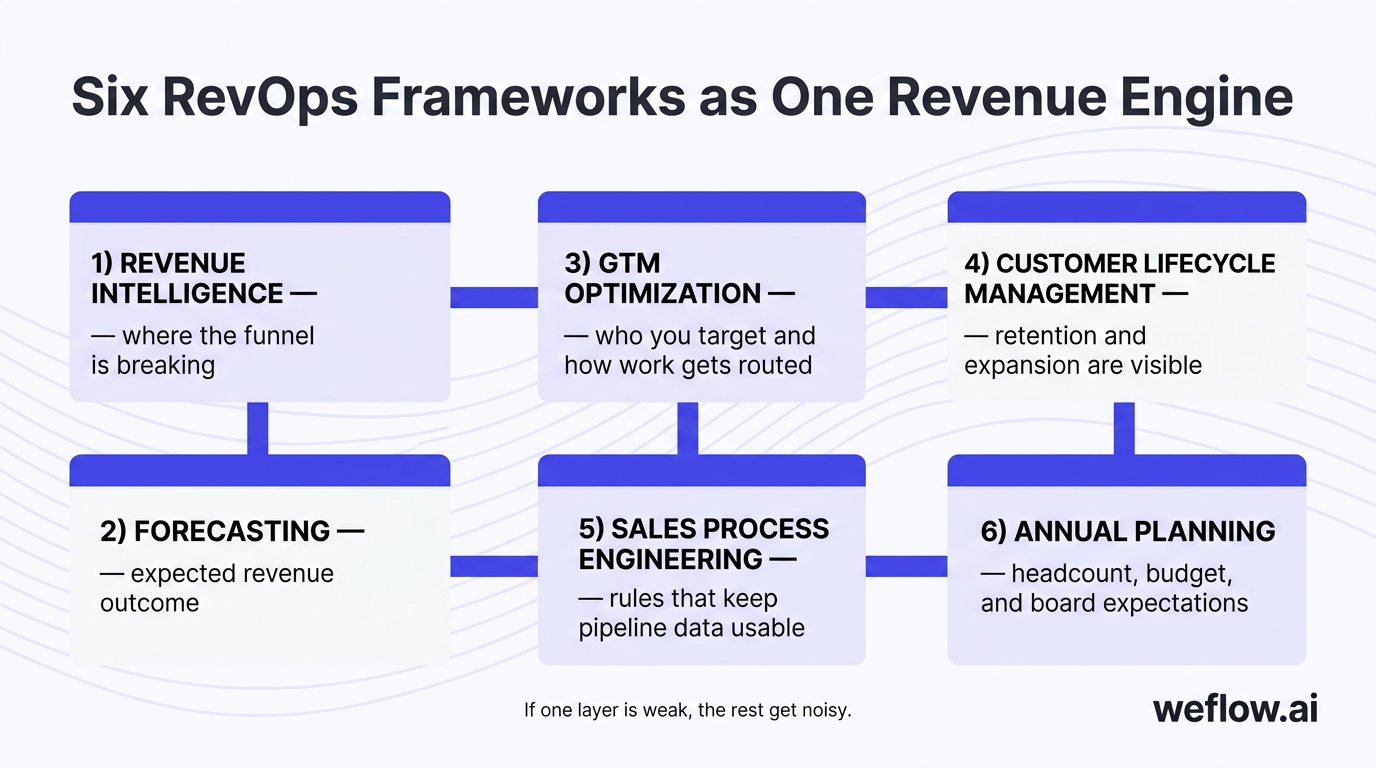
If one layer is weak, the rest get noisy. Clean forecasting without process discipline won’t hold. Great pipeline analysis without lifecycle data will miss retention risk. Annual planning without trustworthy conversion and ramp assumptions will turn into spreadsheet fiction.
Analyze revenue intelligence for pipeline health
Reporting on pipeline tells you what happened. Diagnosing pipeline health tells you why it happened and what to do next. That means moving beyond static dashboards and looking at conversion, activity completeness, deal progression, and segment-level performance together.
| Analysis area | Strategic impact | Action steps |
|---|---|---|
| Pipeline health and conversion | Shows whether current coverage and stage velocity can support target revenue | Track coverage ratio by segment, time in stage, and slippage; tighten stage exit criteria in Salesforce |
| Win/loss analysis | Exposes positioning gaps, pricing friction, and competitor pressure | Standardize loss reason fields, require close-lost notes, and analyze outcomes by persona, ACV, and competitor |
| Forecast variance | Shows whether pipeline data can support board-level predictability | Compare forecast vs. actual by rep, manager, segment, and stage; review variance weekly, not only at quarter end |
| Rep and team performance | Identifies which behaviors correlate with conversion and quota attainment | Measure activity-to-outcome ratios, ramp curves, multithreading rates, and next-step compliance |
| Deal signals and engagement | Helps managers inspect risk before it hits the commit | Flag stale opportunities, missing next steps, silence from buying groups, and pricing objection patterns |
| Tech stack utilization | Prevents underused tools from adding cost and weak data into Salesforce | Review adoption, field mapping quality, sync reliability, and whether each system improves data completeness |
| Attribution and campaign impact | Improves budget allocation across marketing and SDR channels | Connect campaign influence, lead source logic, and opportunity creation to sourced and influenced pipeline |
For Salesforce teams, this usually means tightening the data model. Add required fields where they matter, reduce free-text chaos where they don’t, and make sure activity and conversation data write back in a way that supports reporting instead of creating another data silo.
Standardize forecasting to improve predictability
A forecast becomes trustworthy when it depends less on rep optimism and more on shared rules. The goal isn’t to remove seller judgment completely. It’s to stop judgment from being the main forecasting method.
- Set one forecasting methodology: Define how commit, best case, and upside work across the business. If one manager treats “commit” as a stretch goal and another treats it as a legal oath, your rollup will never stabilize.
- Use stage-to-close probability modeling: Base probabilities on historical conversion data by segment, region, and motion. Enterprise new business should not share the same stage weighting as SMB expansion.
- Standardize stage exit criteria: A deal should only move when objective criteria are met—identified pain, confirmed decision process, next meeting booked, security review started, or mutual action plan in place. Put those rules into Salesforce fields, validation rules, and manager inspection templates.
- Separate rep rollups from top-down models: You need both. Rep forecasts capture deal-level context. Top-down models show whether overall pipeline creation, conversion, and capacity can support the number.
- Run a structured deal inspection process: Forecast calls should focus on risk, not storytelling. Review close date movement, missing next steps, buyer-side multithreading, stage age, and activity gaps.
- Align Finance early: Finance uses the forecast for hiring pace, spend control, and board guidance. If Finance and RevOps work from different assumptions, trust drops fast.
For Salesforce admins and Business Systems teams, this is where configuration matters. Forecast categories, stage mapping, required methodology fields, stale opportunity alerts, and custom forecast views need to support consistent rep behavior without creating extra admin load. Good forecasting architecture reduces subjectivity because the CRM itself enforces cleaner inputs.
Optimize go-to-market motions for lower CAC
RevOps has a direct role in CAC, not just pipeline reporting. Better targeting, cleaner routing, stronger segmentation, and tighter handoffs all reduce wasted effort upstream and downstream.
| GTM area | Optimization method | Strategic impact |
|---|---|---|
| ICP refinement | Analyze win rate, ACV, retention, and sales cycle by industry, size, geography, and use case | Better fit means lower CAC, faster velocity, and stronger retention |
| Market segmentation | Group accounts by needs, product fit, and buying motion—not only employee count | Improves messaging, territory balance, and playbook relevance |
| Territory and account assignment | Use white-space analysis, rep capacity, and account potential to redesign coverage | Raises rep productivity and reduces uneven pipeline distribution |
| Lead scoring and routing | Use firmographic, behavioral, and intent signals; audit SLA adherence and route accuracy | Improves speed-to-lead and lead-to-opportunity conversion |
| Messaging and value proposition | Feed win/loss data and persona-level conversion trends back into sales and marketing | Increases win rate and reduces cycle time |
| Pricing and packaging | Test offers by segment and compare deal size, conversion, and discount patterns | Improves ACV and gross margin discipline |
| Buyer journey alignment | Map actual handoffs across SDR, AE, Solutions, and CS into lifecycle stages inside Salesforce | Reduces friction between teams and improves conversion consistency |
Tightening the ICP has a compounding effect. Better-fit accounts convert faster, need fewer touches, churn less, and create better expansion paths later. That means ICP work is not a marketing exercise. It changes sales velocity, capacity planning, and retention economics.
Manage the customer lifecycle to boost retention
Strategic RevOps doesn’t stop at Closed Won. If post-sale data lives outside Salesforce or never feeds back into the account record, the business loses visibility into renewal risk, expansion timing, and true customer value.
- Onboarding: Standardize the sales-to-CS handoff. Required handoff fields, implementation notes, key stakeholders, product scope, and commercial terms should be complete before the opportunity can move into the closed process. This reduces rework and shortens time to value.
- Adoption: Bring product usage data, milestone completion, and support patterns into the account or customer success data model. Whether you use standard objects, custom objects, or a connected CS platform, the goal is the same: make adoption visible in the same system where renewals are managed.
- Retention: Define churn risk signals early. Usage drops, low stakeholder coverage, support escalation volume, and delayed onboarding milestones should trigger workflow alerts before renewal is in play.
- Expansion: Surface expansion triggers based on usage growth, new buying centers, contract milestones, and product adoption breadth. RevOps should help account teams know when an account is commercially ready, not just active.
- Renewal: Put renewal opportunities, forecast categories, and health indicators into one operating view. Renewals shouldn’t appear as last-minute deals with weak inspection discipline.
For Salesforce teams, this usually means better lifecycle architecture: consistent account hierarchies, renewal opportunity logic, customer health fields or objects, and cleaner integration between CRM, CS, billing, and support systems. Without that, NRR modeling stays manual.
Engineer sales processes to accelerate deal flow
Good process design should increase compliance and reduce admin work at the same time. If a process only adds required fields without improving deal quality or reporting accuracy, reps will work around it and managers will ignore it.
- Define stage rules clearly: Every opportunity stage should have measurable exit criteria. “Demo complete” is weak. “Champion confirmed, business pain documented, next meeting scheduled, and timeline captured” is usable.
- Operationalize methodology: If your team uses MEDDICC, SPICED, or Challenger, put the key fields and inspection prompts into Salesforce. Methodology only matters when it affects stage progression and manager reviews.
- Use validation rules carefully: Validation rules should protect data quality at key moments, not block rep productivity on every save. The right pattern is stage-based enforcement, not blanket form friction.
- Monitor opportunity hygiene: Track stale opportunities, missing next steps, low-touch deals, and close date changes. Those are process signals, not just reporting cleanup tasks.
- Improve routing logic: Lead and opportunity routing should reflect ICP, territory design, account ownership, and SLA commitments. Routing errors create pipeline drag long before they show up in forecasts.
- Connect enablement to process: Sales playbooks, discovery templates, and mutual action plans should match the stages and methodology fields managers inspect.
The balance matters. Strategic RevOps enforces process where it improves forecast confidence and funnel quality, then removes admin burden everywhere else through automation, activity capture, and sensible page layout design.
Plan annual GTM strategies with data-driven models
Annual planning is where strategic RevOps becomes visible to the executive team. This is no longer about maintaining Salesforce. It’s about translating historical performance into a plan the CRO and Finance can defend.
| Planning area | What RevOps should model | Why it matters |
|---|---|---|
| Bottom-up planning | Rep productivity, ramp curves, quota attainment, coverage assumptions, and capacity by segment | Builds a realistic revenue plan grounded in selling capacity |
| Top-down revenue modeling | ARR targets by motion, segment, and region | Connects company growth targets to GTM execution assumptions |
| Territory design | White space, account potential, rep loading, and regional balance | Improves fairness, productivity, and pipeline distribution |
| Budget allocation | Channel ROI, CAC payback, program efficiency, and tooling cost | Supports better spend decisions across Sales, Marketing, and CS |
| Hiring and capacity | Headcount timing, attrition assumptions, manager span, and productivity lag | Prevents quota gaps and over-hiring |
| Change management | System readiness, enablement plans, dashboard updates, and rollout dependencies | Turns strategy into executable operating changes |
This work has to be cross-functional. Finance needs credible assumptions. Sales leadership needs capacity visibility. Marketing needs segment and sourcing targets. Business Systems teams need time to update routing, data models, and dashboards. When RevOps runs this process well, planning becomes an operating discipline instead of a last-minute spreadsheet exercise.
Quarterly RevOps roadmap: sequence initiatives for maximum ROI
You don’t need to do all of this in one quarter. In fact, trying to do that is how teams create a large backlog and no measurable outcome. The better approach is sequencing.
Use this roadmap as a maturity path, not a calendar rule. If your data is still fragmented or your forecast is still based on rep opinion, treat Q1 as your starting point even if it’s already August.
Build data foundations and intelligence in Q1
Don’t skip this phase. Predictive models, scenario planning, and AI layers fail fast when core Salesforce data is incomplete, inconsistent, or two weeks behind reality.
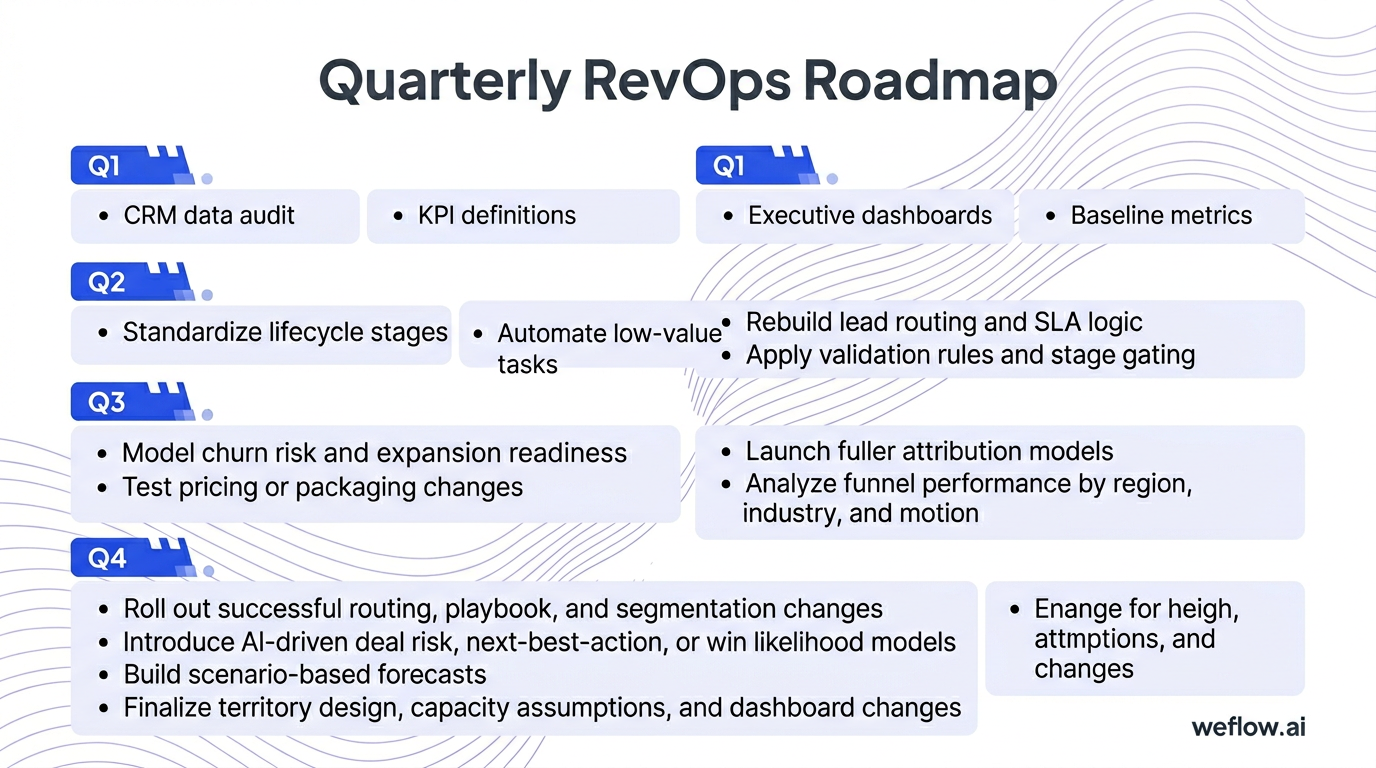
- Run a CRM data audit across opportunity stages, close dates, activity completeness, account hierarchies, and required fields.
- Document KPI definitions for pipeline, sourced pipeline, forecast categories, churn, and NRR.
- Build executive dashboards for revenue, pipeline coverage, stage velocity, and retention signals.
- Set baseline metrics for forecast error rate, win rate, CAC payback, pipeline velocity, and renewal visibility.
Automate workflows and optimize processes in Q2
This is the efficiency phase. Reps should start feeling the benefit here—less admin work, faster routing, fewer broken handoffs, and cleaner pipeline inspection.
- Standardize lifecycle stages across lead, opportunity, customer, and renewal workflows.
- Automate low-value tasks such as follow-up reminders, stale deal alerts, and exception reporting.
- Rebuild lead routing and SLA logic around ICP, territory rules, and account ownership.
- Apply validation rules and stage gating where they improve data quality without blocking seller flow.
Deploy advanced analytics and predictive models in Q3
Once the data and process layers are stable, RevOps can move from measurement to intervention. This is where the function starts acting like a revenue-generating team, not just a reporting team.
- Model churn risk and expansion readiness using product usage, support data, and account engagement.
- Test pricing or packaging changes by segment and compare impact on conversion, discounting, and ACV.
- Launch fuller attribution models tied to sourced pipeline and revenue outcomes.
- Analyze funnel performance by region, industry, and motion to refine playbooks and capacity choices.
Scale regional plays and AI innovations in Q4
Q4 is where you scale what worked and prepare next year’s plan. It should connect directly back to the annual GTM planning framework—territories, capacity, forecast scenarios, and systems readiness.
- Roll out successful routing, playbook, and segmentation changes into new geographies or verticals.
- Introduce AI-driven deal risk, next-best-action, or win likelihood models where the underlying data is trustworthy.
- Build scenario-based forecasts by segment, region, and hiring plan for board and budget cycles.
- Finalize territory design, capacity assumptions, and dashboard changes for the next fiscal year.
RevOps performance metrics: track efficiency and revenue outcomes
Strategic RevOps needs a board-ready scorecard. That means fewer vanity metrics and more indicators that show whether growth is predictable, efficient, and durable.
A useful Strategic Metrics Dashboard tracks three things for each KPI: current status, target, and action plan. Numbers alone don’t tell leadership what happens next. Your dashboard should make the next operating decision obvious.
| Metric category | Key metric | Target | Strategic objective |
|---|---|---|---|
| Revenue | Forecast accuracy | Within 5% of actual | Improve planning confidence and board trust |
| Revenue | Pipeline velocity | 15–20% faster cycle | Turn pipeline into revenue sooner |
| Efficiency | CAC payback period | Under 12 months | Improve GTM efficiency and capital use |
| Efficiency | Quota attainment | 10%+ improvement | Raise selling productivity and capacity yield |
| Customer | NRR | 110%+ | Protect and expand recurring revenue |
| Customer | Churn rate | Below 5% or improving by 15–25% | Reduce revenue leakage and improve valuation quality |
Measure revenue metrics to validate forecast accuracy
Revenue metrics answer a simple question: is the sales engine predictable enough to plan against? Pipeline velocity matters here because it multiplies the effect of win rate, deal size, and conversion. Faster movement through the funnel makes every other revenue metric work harder.
- Forecast accuracy variance: Target within 5% of actual results. Break it down by rep, manager, segment, and forecast category so you can see where subjectivity still enters the model.
- Pipeline velocity: Target a 15–20% reduction in sales cycle length. Measure stage duration, slippage, and time from opportunity creation to closed outcome.
- Win rate: Target 10–15% year-over-year improvement. Slice by ICP segment, competitor, source, and pricing band to find where quality is strongest.
- Average deal size: Target 20%+ growth where pricing, packaging, and enterprise motion support it. Watch for discount creep so deal size growth is real, not inflated list price.
Track efficiency metrics to shorten payback periods
Efficiency metrics show whether the company is buying growth at a sensible cost. Ramp time matters more than many teams admit because it changes hiring math, territory coverage, and how quickly new headcount becomes productive capacity.
- CAC payback period: Target under 12 months. Review by segment and source, not only at the blended company level.
- Sales productivity: Target 10%+ improvement in quota attainment or bookings per rep. Tie this back to territory balance, manager inspection quality, and process friction.
- Lead-to-customer conversion: Target 25%+ improvement where routing and qualification are weak today. This metric often exposes issues earlier than win rate alone.
- Ramp time: Target a 30% reduction where onboarding and enablement are inconsistent. Faster ramp improves capacity planning because the revenue model becomes less dependent on long productivity delays.
Monitor customer metrics to protect net revenue retention
Customer metrics determine whether growth holds up after new logo revenue lands. For SaaS boards and investors, NRR is often the clearest signal that the business can grow without replacing the same revenue every year.
- Net revenue retention: Target 110%+. Track by segment, cohort, and product line so expansion and contraction patterns are visible.
- Customer lifetime value: Target 20%+ growth. CLV improves when retention, gross margin, and expansion all improve together.
- Churn rate: Target a 15–25% reduction or keep it under your segment-specific threshold. Measure both logo churn and revenue churn.
- Expansion revenue: Target 30%+ annual growth where the product supports cross-sell or usage growth. The key is surfacing expansion triggers early enough for account teams to act.
FAQ
How does strategic RevOps differ from tactical operations?
Tactical operations focus on short-term execution: report requests, workflow fixes, routing updates, and Salesforce administration. Strategic RevOps uses those same systems and data assets to shape forecasting, capacity planning, GTM alignment, and board-level reporting over the next two to six quarters.
How can RevOps improve sales forecast accuracy?
Forecast accuracy improves when stage exit criteria are objective, forecast categories are used consistently, and probability models are based on historical conversion data instead of rep opinion. The biggest gains usually come from weekly variance reviews, better deal inspection, and Salesforce controls that catch stale close dates, missing next steps, and weak stage hygiene before the forecast call.
Which RevOps metrics matter most to executive boards?
The three that usually matter most are forecast accuracy, CAC payback period, and NRR because together they show predictability, efficiency, and durability of growth. Boards may also want pipeline coverage, pipeline velocity, and churn rate, but those are most useful when they’re tied to an action plan rather than shown as isolated trend lines.
How should RevOps sequence annual GTM planning?
Start with bottom-up productivity and capacity models, then compare those against top-down revenue targets from leadership and Finance. After that, move into territory design, budget allocation, hiring timing, and systems readiness so Salesforce workflows, routing logic, dashboards, and forecasting assumptions are ready before the new plan goes live.
.webp)

.webp)
.webp)

.webp)

.webp)
.webp)
.webp)

.webp)