

35 B2B SaaS Metrics to Track Growth, Efficiency, and Retention [Cheat Sheet]
Most SaaS teams don’t have a metric problem. They have a consistency problem. Marketing, Sales, Finance, and Customer Success often track the right numbers, but they define them differently, update them on different cadences, and present them in separate tools.
This guide gives you one benchmark cheat sheet across the full customer journey—from Awareness to Growth. Use it to pressure-test your current dashboard, set stage-appropriate targets, and spot where performance issues start before they show up in board reporting.
[banner type="download" url="https://www.weflow.ai/content/b2b-saas-metrics-cheat-sheet" text="B2B SaaS Metrics & Benchmarks Cheat Sheet" subtitle="Get benchmark tables, metric formulas, and investor KPI definitions for B2B SaaS." button="Download now"]
Investor metrics: prove valuation and capital efficiency
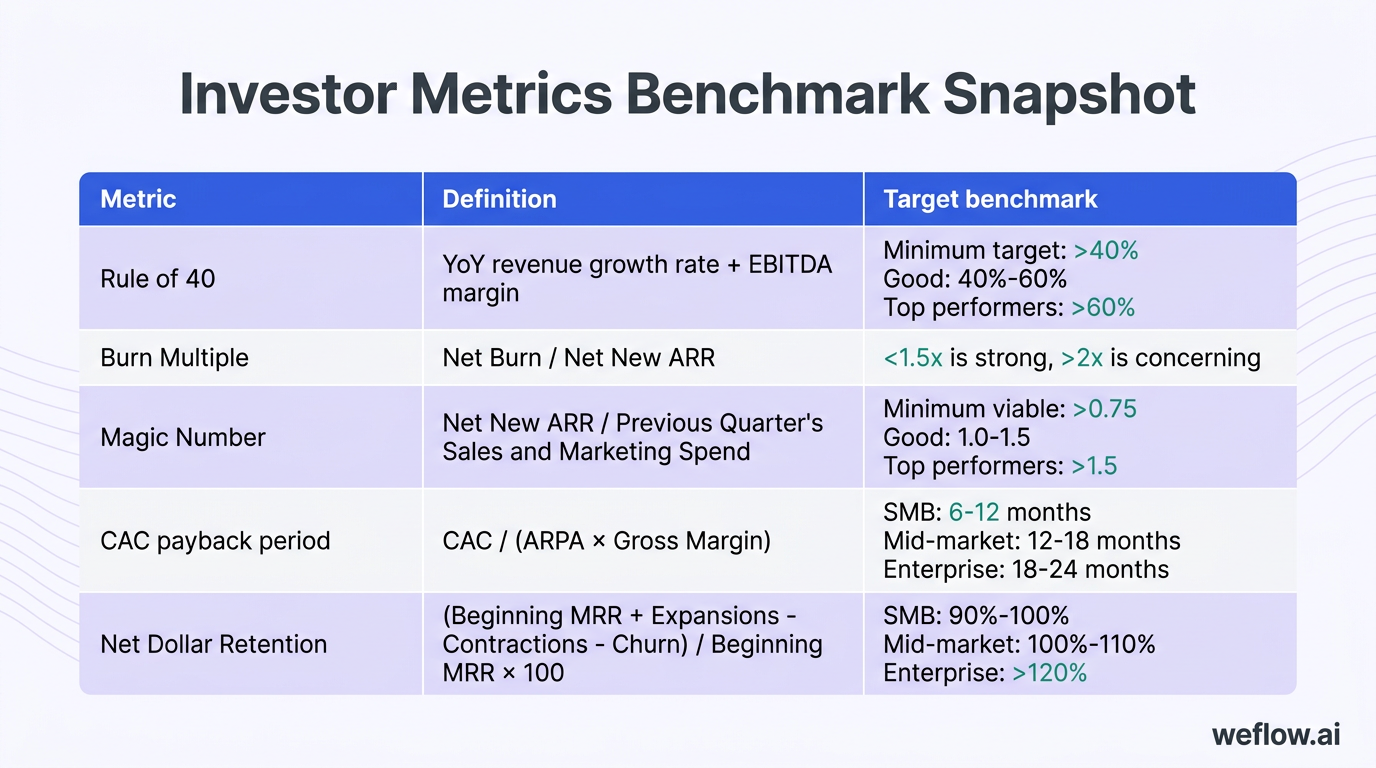
These are the metrics investors, finance leaders, and boards use to judge whether growth is efficient enough to support valuation. They look at three things: how fast revenue grows, how much cash that growth consumes, and whether existing customers expand fast enough to offset churn.
Group | Metric | Definition | Target benchmark |
|---|---|---|---|
Profitability and growth | Rule of 40 | YoY revenue growth rate + EBITDA margin | Minimum target: >40% |
Profitability and growth | EBITDA margin | (EBITDA / Revenue) × 100 | Public SaaS median: 6% |
Spending efficiency | Burn Multiple | Net Burn / Net New ARR | <1.5x is strong |
Spending efficiency | FCF margin | ((Operating Cash Flow - CapEx) / Revenue) × 100 | Startups under $2.5M ARR median: -308% |
Acquisition ROI | Magic Number | Net New ARR / Previous Quarter's Sales and Marketing Spend | Minimum viable: >0.75 |
Acquisition ROI | CAC payback period | CAC / (ARPA × Gross Margin) | SMB: 6-12 months |
Acquisition ROI | LTV/CAC | LTV / CAC | Minimum viable: 3:1 |
Retention quality | Net Dollar Retention | (Beginning MRR + Expansions - Contractions - Churn) / Beginning MRR × 100 | SMB: 90%-100% |
Retention quality | Gross Dollar Retention | Recurring revenue retained from existing customers, excluding expansion | Good: >85% |
Early-stage companies usually get more room on profitability if growth stays high. Later-stage SaaS companies get judged more harshly on margins, cash generation, and retention quality because investors expect repeatable growth, not growth at any cost.
Track core profitability and growth ratios
Rule of 40 = YoY revenue growth rate + EBITDA margin. A company growing 30% year over year with a 10% EBITDA margin scores 40%. Earlier-stage companies often carry the score through growth, while mature companies carry more of it through margin.
Burn Multiple = Net Burn / Net New ARR. This shows how many dollars you spend to add one dollar of new ARR. Under 1.5x is healthy, while anything above 2x usually triggers questions about go-to-market efficiency.
FCF margin = ((Operating Cash Flow - CapEx) / Revenue) × 100. Free cash flow matters more as companies mature because it shows whether reported growth turns into usable cash.
EBITDA margin = (EBITDA / Revenue) × 100. This is the standard profitability view for public SaaS comps and board-level performance reviews.
Burn Multiple is usually more forgiving than EBITDA for early-stage SaaS because it measures how efficiently spend converts into new ARR, even when the business is still intentionally operating at a loss.
Measure customer acquisition return on investment
These metrics answer a simple question: are sales and marketing dollars turning into recurring revenue fast enough to justify the spend?
Magic Number tells you whether incremental go-to-market spend is producing enough new ARR. Below 0.75 usually points to weak conversion, poor pricing, or rising acquisition costs.
CAC payback period shows how long it takes to recover acquisition cost from gross-margin-adjusted account revenue. Shorter is better, but the acceptable range changes by segment.
LTV/CAC shows whether customer value is large enough to justify acquisition cost over time. Below 3:1 is a warning sign. Above 5:1 usually means acquisition is efficient and retention is holding up.
CAC payback and LTV/CAC should move together. If payback is long and LTV/CAC is also weak, you’re paying too much for customers who don’t stay long enough or expand enough. If payback is long but LTV/CAC is still strong, that can be acceptable in enterprise SaaS where contract values are higher, sales cycles are longer, and customers renew for years.
Enterprise CAC payback periods are naturally longer than SMB because deal cycles run longer, sales teams carry higher fully loaded cost, and implementation work is heavier. Investors accept that tradeoff when retention, expansion, and gross margins support it.
Financial metrics: monitor revenue growth and cash runway
Investor metrics tell the market story. Financial operating metrics tell you whether the business can keep funding that story. The goal here is to track recurring revenue momentum without losing sight of burn, cash timing, and margin structure.
Growth metrics
Metric | Definition | Benchmark |
|---|---|---|
ARR | Normalized annual value of active recurring subscriptions | Seed: $0.2M-$1M |
MRR | Total predictable monthly recurring subscription revenue | Early-stage monthly growth: 10%-15% |
YoY growth rate | ((Current Period - Prior Period) / Prior Period) × 100 | Early-stage: 3x, 3x, 2x, 2x |
QoQ growth rate | ((Current Quarter - Previous Quarter) / Previous Quarter) × 100 | Early-stage: 15%-25% |
Logo growth rate | ((End of Period Customers - Start of Period Customers) / Start of Period Customers) × 100 | Early-stage: >10% monthly |
Financial health metrics
Metric | Definition | Benchmark |
|---|---|---|
Burn rate | Monthly net cash spend | Should not exceed 1/12 of the last funding round as a rough control point |
Runway | Current cash balance / Monthly burn rate | Minimum: 12 months |
Cash conversion cycle | Time between paying to acquire and serve customers and collecting cash from them | Annual upfront contracts: negative CCC |
Gross margin | ((Revenue - COGS) / Revenue) × 100 | Infrastructure SaaS: 65%-75% |
Operating expense ratio | (Total Operating Expenses / Revenue) × 100 | Early-stage: 150%-200% |
Calculate recurring revenue and growth rates
ARR includes only recurring subscription revenue. Include subscription commitments, term subscriptions, and recurring usage revenue if it is contractually recurring. Exclude one-time setup fees, professional services, training, and other non-recurring charges.
MRR is the monthly view of recurring revenue. Use it for monthly pacing, cohort analysis, and fast-moving planning. ARR is better for board reporting and annual planning.
YoY growth rate is the cleanest way to compare scale over time. It smooths out seasonality and is the metric most investors expect to see first.
QoQ growth rate shows momentum shifts sooner. It helps operators spot whether a slowdown is temporary or the start of a broader trend.
Logo growth rate matters when you’re still building customer count. But as ACV rises, revenue growth tells a better story than raw logo count.
One-time fees and services must stay out of ARR and MRR because they distort recurring revenue quality. If you include them, you’ll overstate predictable revenue and understate the real payback period on customer acquisition.
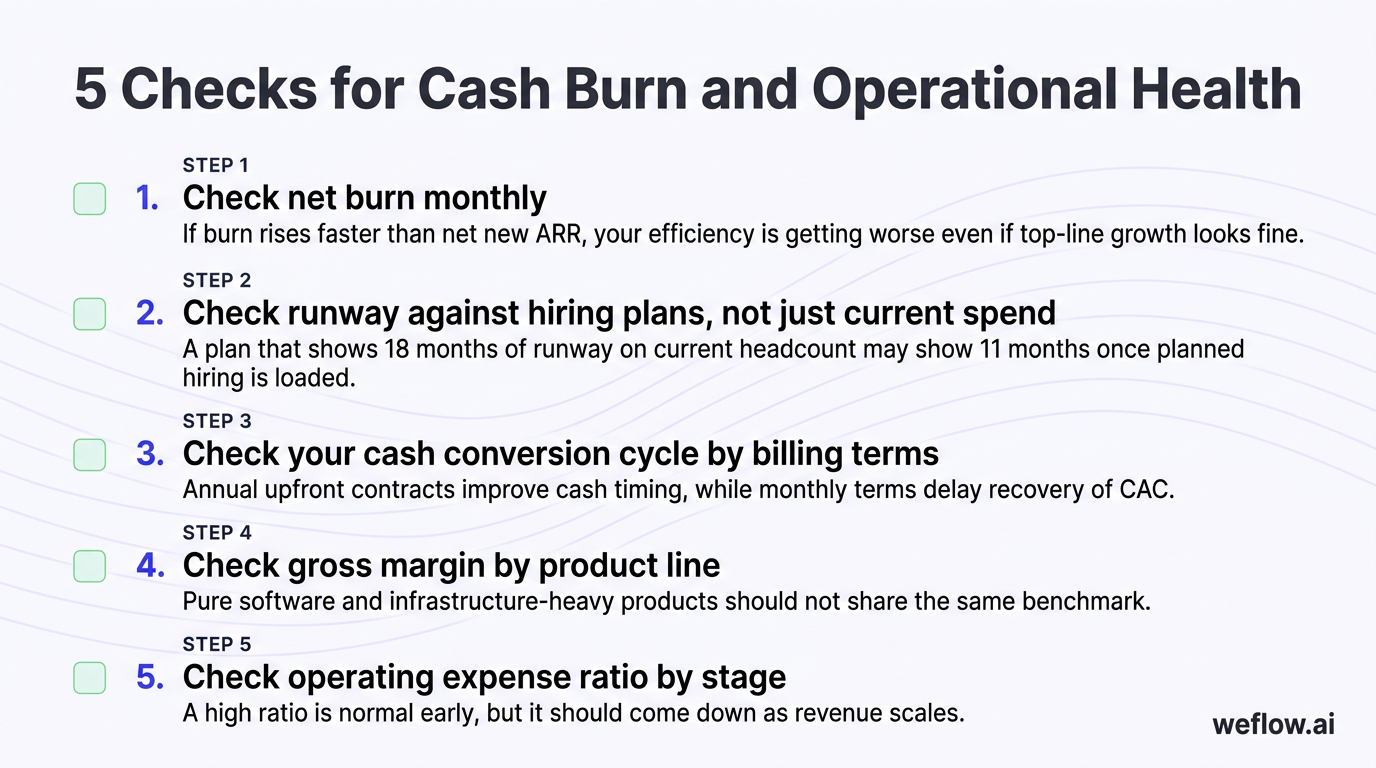
Assess cash burn and operational health
Check net burn monthly. If burn rises faster than net new ARR, your efficiency is getting worse even if top-line growth looks fine.
Check runway against hiring plans, not just current spend. A plan that shows 18 months of runway on current headcount may show 11 months once planned hiring is loaded.
Check your cash conversion cycle by billing terms. Annual upfront contracts improve cash timing, while monthly terms delay recovery of CAC.
Check gross margin by product line. Pure software and infrastructure-heavy products should not share the same benchmark.
Check operating expense ratio by stage. A high ratio is normal early, but it should come down as revenue scales.
Pure SaaS businesses usually run higher gross margins than infrastructure SaaS because hosting, storage, and compute cost less as a share of revenue. If you sell an infrastructure-heavy product, 65%-75% gross margin can still be healthy.
Annual upfront contracts can create a negative cash conversion cycle, which is one of the biggest cash flow advantages in SaaS. You collect cash before fully incurring the cost to serve the customer.
Marketing metrics: optimize lead generation and web traffic
Marketing metrics sit at the Awareness and Consideration stages of the customer journey. They tell you whether demand generation is producing the right lead volume, whether traffic quality is holding up, and whether paid spend is staying within acceptable acquisition cost bands.
Lead generation: MQL to SQL conversion rate, cost per MQL, lead scoring effectiveness, and MQL response time tell you whether top-of-funnel volume is turning into pipeline.
Website performance: unique visitors, time on site, bounce rate, visitor-to-lead conversion, traffic source mix, CPC, and CPA tell you whether brand demand and paid acquisition are efficient enough to scale.
Evaluate MQL volume and conversion efficiency
Metric | B2B SaaS benchmark | Why it matters |
|---|---|---|
MQL to SQL conversion rate | 15%-30% | Shows whether lead quality and sales acceptance are aligned |
Cost per MQL | $30-$100 | Shows whether top-of-funnel growth is becoming too expensive |
MQL growth rate | 10%-20% YoY | Shows whether demand generation is expanding fast enough to support pipeline targets |
Lead scoring effectiveness | >60% of MQLs convert to SALs | Shows whether scoring logic matches what sales will actually work |
MQL response time | <1 hour | Shows whether speed-to-lead is helping or hurting conversion |
MQL response time matters more than most dashboards show. Once response slips past the first hour, contact rates usually fall, lead context goes stale, and MQL to SQL conversion drops even if lead quality stays flat.
Analyze website engagement and acquisition costs
Time on site: More than 2-3 minutes is healthy. More than four minutes usually means visitors are finding content that matches intent.
Bounce rate: For B2B websites, 40%-60% is a workable range. Higher rates can mean weak landing page relevance, poor traffic quality, or slow page performance.
Visitor-to-lead conversion: 2%-5% is a common range, while top performers exceed 5%. Track this by channel, not just site-wide, because branded organic traffic behaves differently than paid social.
Traffic source distribution:
Organic: 40%-50%
Direct: 15%-25%
Paid: 15%-25%
Referral: 10%-15%
Social: 5%-10%
CPC benchmarks:
Google Ads: $2-$7
LinkedIn: $5-$15
Meta: $1-$3
CPA benchmarks:
SMB: $100-$500
Mid-market: $500-$2,000
Enterprise: $2,000-$10,000+
B2B SaaS companies usually need a healthy organic base to keep blended CPA under control. If too much traffic comes from paid channels, acquisition cost rises fast and your payback period gets worse even when lead volume looks good.
Sales metrics: accelerate pipeline velocity and close rates
Sales metrics sit in the Decision stage of the customer journey. These are the numbers sales leaders, RevOps teams, and forecast owners use to decide whether pipeline is real, whether reps have enough coverage, and whether execution is strong enough to convert committed deals on time.
Start with pipeline coverage. If there isn’t enough qualified pipeline for the target period, nothing further down the process will save the number.
Check Pipeline velocity. Slow movement usually shows up before win rates fall.
Check average deal size and sales cycle length. These tell you whether the team is moving upmarket and whether deals are taking longer to convert.
Check win rate and SQL conversion. These separate qualification issues from execution issues.
Check rep ramp time and capacity utilization. If too much selling time goes to CRM admin, internal meetings, or poor handoffs, rep output drops before headcount planning catches it.
Monitor pipeline coverage and deal movement
Segment | Average deal size | Win rate | Sales cycle length | Coverage ratio |
|---|---|---|---|---|
SMB | $1K-$10K | 20%-30% | 1-3 months | Typically lower than mid-market and enterprise |
Mid-market | $10K-$100K | 20%-30% | 3-6 months | 5x-6x |
Enterprise | $100K+ | 15%-25% | 6-12+ months | 3x-4x baseline |
Pipeline coverage ratio = Total pipeline value / Revenue target for the period.
Pipeline velocity = (Number of Deals × Average Deal Size × Win Rate) / Sales Cycle Length.
Healthy pipelines usually keep stagnant deals under 20%. Once that number climbs, forecast quality drops.
Coverage targets depend on how strictly you qualify pipeline. Many teams use 3x-4x for enterprise and 5x-6x for mid-market because mid-market pipelines often contain more early-stage volume. If your enterprise cycle is longer, more political, or less predictable than average, raise the enterprise coverage target rather than holding the same ratio across every segment.
Track rep productivity and win ratios
SQL conversion rate: 20%-30% for well-qualified leads, with top performers above 35%.
Win rate: 20%-30% overall in B2B SaaS, often lower in enterprise due to longer cycles and larger buying groups.
Sales productivity ramp time: SDRs usually need 3-4 months, AEs 6-9 months, and enterprise AEs 9-12 months to reach full productivity.
Sales capacity utilization: Top teams spend more than 60% of rep time on selling activity. The broader average sits closer to 35%-45%.
Quote-to-close ratio: 20%-30% is common, while stronger teams push above 40%.
Typical daily and weekly activity targets
SDRs: 30-50 calls per day, 50-75 emails per day, and enough booked meetings to keep SQL creation on plan.
AEs: 15-20 calls per day, 20-30 emails per day, two to three meetings per day, and a manageable book of 15-30 active opportunities depending on deal size.
Tracking sales capacity utilization is one of the fastest ways to find process waste. If reps spend too much time updating fields, logging activity, fixing bad opportunity data, or chasing internal approvals, the issue isn’t just productivity—it’s data quality and process design.
Customer success metrics: drive retention and account growth
Customer Success metrics cover the Adoption, Retention, and Growth stages of the journey. They tell you whether customers reach value fast enough, whether sentiment is holding up, and whether your installed base is expanding faster than it contracts.
Adoption: Time to First Value, product adoption rate, and feature usage depth show whether customers are building the product into daily work.
Satisfaction: NPS, CSAT, support ticket volume, and response or resolution time show whether customers feel friction and how fast your team removes it.
Retention: Customer churn, revenue churn, NRR, GRR, CLV, and Expansion revenue show whether the customer base stays, renews, and grows.
Measure product adoption and time to value
Time to First Value (TTFV) is the time between purchase and the first clear value milestone. It is often the strongest leading indicator of renewal because customers who reach value quickly are more likely to adopt core workflows, add users, and stay through the first renewal cycle.
TTFV benchmarks: SMB products should usually deliver first value in days to weeks. Enterprise software often takes one to three months because setup, security review, and process change take longer.
Product adoption rate: More than 60% is healthy, while more than 80% signals strong product fit and good onboarding.
Feature usage metrics: Core features should be used by more than 80% of customers. Secondary features above 40% usually indicate room for expansion plays.
Customer Success teams should define value milestones in product terms, not vague satisfaction terms. For one product that might be the first live dashboard, for another it might be the first Salesforce write-back, first automated workflow, or first weekly executive report sent from production data.
Gauge customer satisfaction and support load
Metric | What it measures | Benchmark |
|---|---|---|
NPS | Longer-term loyalty and willingness to recommend | B2B SaaS: 30-40 |
CSAT | Satisfaction with a specific interaction, workflow, or support event | B2B SaaS: 75%-85% |
NPS formula: % Promoters (9-10) minus % Detractors (0-6).
Support ticket volume: Under two tickets per customer per month is a useful reference point, though the right number depends on product complexity.
Support response and resolution: First response under four hours and resolution under 24 hours are strong targets for most B2B SaaS teams.
High support ticket volume is not automatically a problem. Complex products often generate more tickets, and that can be healthy if adoption is high and resolution times stay low.
Calculate churn, retention, and lifetime value
Customer churn rate: Percentage of customers that cancel or do not renew in a given period. SMB churn often runs 3%-5% monthly, while enterprise should stay below 1% monthly.
Revenue churn rate: Percentage of recurring revenue lost from existing customers. Enterprise SaaS should usually stay under 5% annually.
NRR formula: (Beginning MRR + Expansions - Contractions - Churn) / Beginning MRR × 100. Good starts above 100%, great sits above 110%, and top performers exceed 120%.
GRR formula: (Beginning MRR - Contractions - Churn) / Beginning MRR × 100. Good starts above 85%, great sits above 90%, and top performers exceed 95%.
CLV: Total expected revenue from a customer across the relationship. A healthy target is usually 3x-5x CAC.
Expansion revenue: Revenue from upsells, cross-sells, or usage growth. Many healthy SaaS companies target 20%-30% of total revenue from expansion, while stronger expansion models exceed 40%.
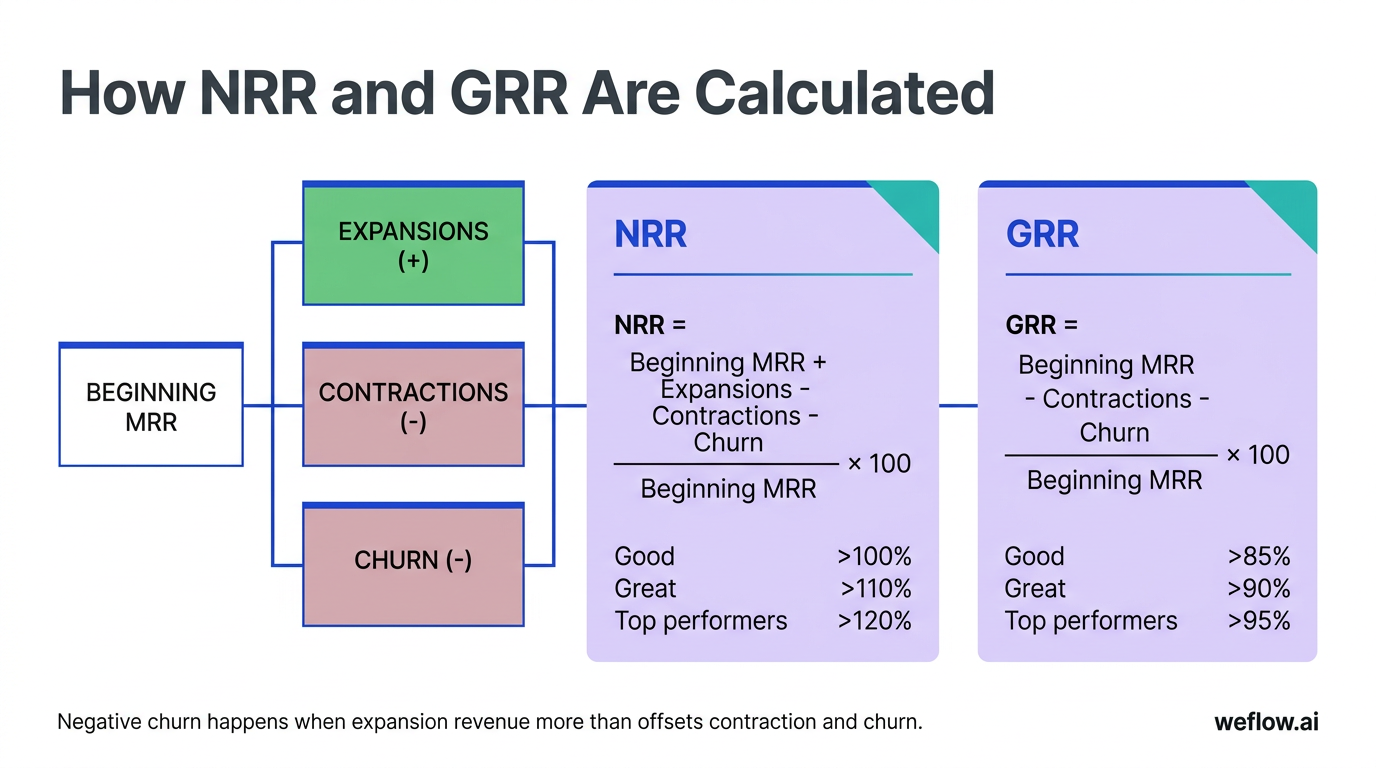
Negative churn happens when expansion revenue more than offsets contraction and churn. That is how strong SaaS companies push NRR above 100% even if some customers leave or downsize.
FAQ
What is the difference between NRR and GRR?
GRR measures how much recurring revenue you kept from existing customers before expansion, while NRR includes upsells, cross-sells, and usage growth. GRR shows the health of the core product because it isolates churn and contraction, while NRR shows whether your account base can grow after the initial sale.
What is a good CAC payback period for SaaS?
A good CAC payback period depends on segment, but under 12 months is the cleanest target. SMB SaaS often lands in the 6-12 month range, while enterprise can sit at 18-24 months because deal sizes are larger, sales cycles are longer, and more upfront capital is required to sustain growth.
How do you calculate the Rule of 40?
Rule of 40 = YoY Revenue Growth Rate + EBITDA Margin
If your company is growing 30% year over year and running a 10% EBITDA margin, your Rule of 40 score is 40%. The benchmark matters because it balances growth and profitability in one number that investors can compare across SaaS companies.
Why is Time to First Value (TTFV) important?
TTFV matters because it is one of the strongest early indicators of churn, renewal risk, and long-term product adoption. When customers reach a meaningful value milestone quickly, they are more likely to build the product into daily workflows, renew on time, and expand later, which improves both LTV and NRR.
.webp)

.webp)
.webp)

.webp)
.webp)
.webp)
.webp)

.webp)