

$100M ARR GTM Strategy RevOps Leaders Build to Scale Efficiently
Getting from early traction to $100M ARR usually doesn’t break because of one bad quarter. It breaks when your go-to-market motion outgrows the systems, process controls, and reporting logic underneath it.
For RevOps leaders, that means the job shifts from supporting growth to making growth repeatable. This guide turns the cheat sheet into an operating framework: how to define your ICP, match your GTM motion to deal size, enforce process compliance, fix common scaling issues, and track the metrics investors will ask about.
[banner type="download" url="https://www.weflow.ai/content/b2b-gtm-cheat-sheet" text="GTM Strategy Cheat Sheet for RevOps & CROs" subtitle="Frameworks, checklists, and challenge-solution maps for scaling GTM to $100M ARR." button="Download now"]Growth fundamentals: building a scalable revenue engine
Before you add headcount, expand upmarket, or layer in a second motion, you need a revenue engine that can handle more volume without breaking forecast accuracy or CRM data quality. Most scaling issues show up later as symptoms—low pipeline coverage, inconsistent stage progression, rep underperformance, and board reporting no one trusts—but the root cause usually starts here.
- Ideal customer profile: Define who gets value fastest, renews at the highest rates, and expands over time.
- Positioning and messaging: Make the problem, outcome, and differentiation clear enough that reps can repeat it consistently.
- GTM strategy and channels: Match your sales motion and acquisition channels to ACV, complexity, and buying behavior.
- Marketing: Build demand in channels that fit the motion instead of spreading budget across every possible source.
- Sales process: Standardize how deals are qualified, advanced, inspected, and forecasted.
- Customer success: Move from reactive support to a structured post-sale model tied to adoption, retention, and expansion.
- Revenue operations: Connect the full journey in Salesforce with shared definitions, clean data, and operating cadence.
Internal discovery is usually the safest starting point for ICP work because it uses evidence you already own. If you analyze customers with the highest NRR, fastest time-to-value, shortest implementation cycles, and cleanest renewals, you’ll usually find the segment where your product creates the most repeatable impact—not just the segment your sales team likes talking to most.
Define your ideal customer profile and buying process
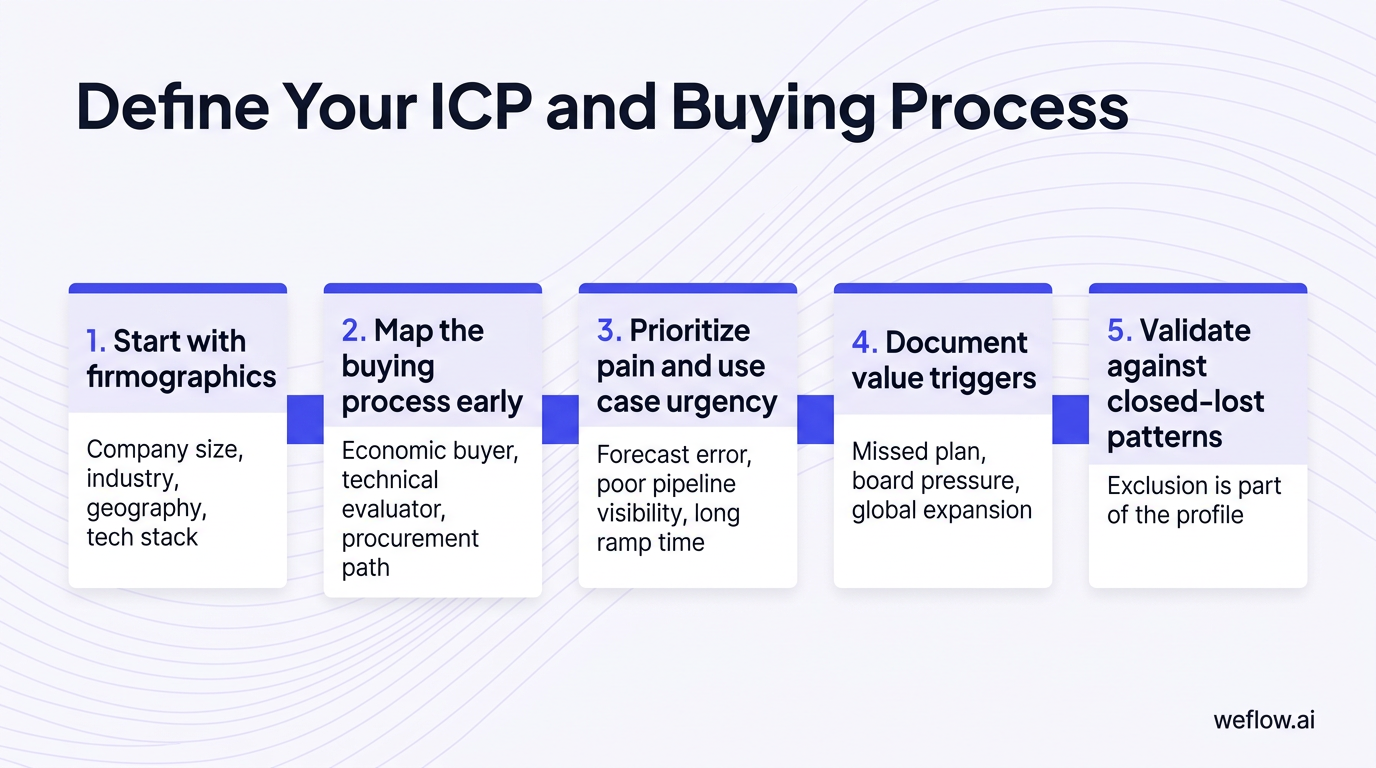
- Start with firmographics. Look at company size, industry, geography, tech stack, team structure, compliance requirements, and budget shape. For RevOps teams, this often means separating mid-market and enterprise B2B organizations instead of treating them as one segment.
- Map the buying process early. Identify the economic buyer, day-to-day owner, technical evaluator, security stakeholder, procurement path, and executive sponsor. If you wait until proposal stage to learn who controls budget or InfoSec review, your cycle length will show it.
- Prioritize pain and use case urgency. The best-fit buyers usually have a costly problem they already feel—forecast error, poor pipeline visibility, low Salesforce data completeness, or long ramp time for new reps.
- Document value triggers. Note what creates urgency: missed plan, board pressure, global expansion, PE efficiency mandates, or a Salesforce cleanup initiative.
- Validate against closed-lost patterns. A strong ICP is as much about exclusion as inclusion. If deals consistently stall in certain subsegments, capture that as part of the profile.
Mapping decision-makers early shortens the sales cycle because it changes deal strategy before the opportunity goes stale. Your reps can build mutual action plans, sequence the right stakeholders, and avoid late-stage surprises that turn a 90-day deal into a 180-day deal.
Draft a positioning statement that highlights unique value
Positioning statement formula:
[Product Name] is a [Category] that helps [Target Audience] to [Key Benefit] by [Unique Approach]; unlike [Alternative], we [Key Differentiator].
This formula works because it forces discipline. It answers four questions quickly: who it’s for, what outcome it creates, how it works, and why it’s different from the alternative your buyer is already considering.
Example: Acme is a revenue planning platform that helps RevOps leaders improve forecast accuracy by combining Salesforce pipeline data with scenario modeling; unlike spreadsheet-based planning, it updates live as deal risk changes.
GTM motions: match your sales strategy to deal size
Your GTM motion should follow deal economics, implementation complexity, and buyer behavior—not founder preference. A $150K multi-stakeholder sale needs a different team, Channel mix, and success model than a $12K self-serve motion.
As companies move toward $100M ARR, many stop running a single motion. They layer a hybrid model—enterprise for strategic accounts, mid-market for scale, and product-led or partner-assisted paths where lower-friction acquisition makes sense.
| Motion | Typical ACV | Sales cycle length | Key investments |
|---|---|---|---|
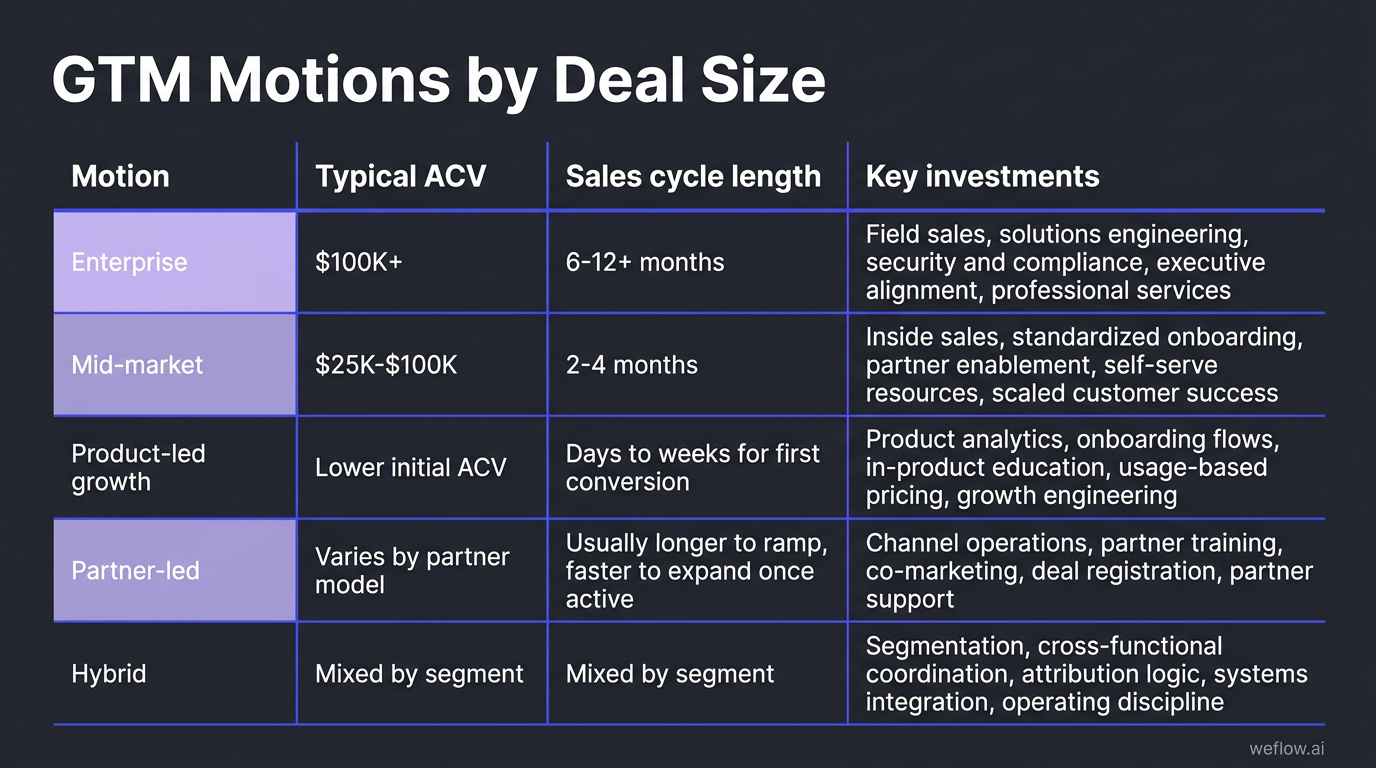
| Enterprise | $100K+ | 6-12+ months | Field sales, solutions engineering, security and compliance, executive alignment, professional services |
| Mid-market | $25K-$100K | 2-4 months | Inside sales, standardized onboarding, partner enablement, self-serve resources, scaled customer success |
| Product-led growth | Lower initial ACV | Days to weeks for first conversion | Product analytics, onboarding flows, in-product education, usage-based pricing, growth engineering |
| Partner-led | Varies by partner model | Usually longer to ramp, faster to expand once active | Channel operations, partner training, co-marketing, deal registration, partner support |
| Hybrid | Mixed by segment | Mixed by segment | Segmentation, cross-functional coordination, attribution logic, systems integration, operating discipline |
Compare enterprise, mid-market, and product-led growth
- Enterprise: This motion depends on experienced AEs, solutions engineers, security review support, and often professional services. Success is measured through deal size growth, strategic logo acquisition, reference accounts, and forecast precision across long cycles.
- Mid-market: This motion wins through process standardization. You need inside sales coverage, repeatable discovery, lighter technical support, faster onboarding, and customer success models that can handle volume without losing adoption quality.
- Product-led growth: This motion depends less on rep persuasion and more on product activation, self-serve onboarding, feature adoption, and expansion design. Product analytics, conversion instrumentation, and lifecycle messaging matter as much as quota capacity.
CAC payback expectations shift hard between motions. In PLG, teams usually need faster recovery because ACVs are lower and volume has to carry the model; in enterprise, longer payback can still work because contract size, retention, and expansion are larger—though investors will still expect the economics to tighten as you scale.
Select marketing channels that align with your motion
Channel mix should mirror how buyers discover, evaluate, and buy in each motion. If your sales motion is enterprise and your budget is mostly going to low-intent lead volume, you’ll get dashboard activity without pipeline quality.
| Channel set | Best fit motion |
|---|---|
|
Mid-market demand capture and targeted enterprise account coverage |
|
PLG and mid-market motions that benefit from high-intent inbound and lower CAC over time |
|
Enterprise motions where trust, stakeholder access, and deal size justify higher-cost field programs |
|
Mid-market education and category creation where buyers need more context before engaging sales |
|
Enterprise and mid-market motions where timing, buying committee access, and account selection matter more than raw volume |
|
Partner-led and hybrid motions where credibility and distribution come from existing ecosystems |
Field events usually fit enterprise because they help reps build consensus across multiple stakeholders. SEO and self-serve educational content fit PLG better because they lower cost to acquire and help buyers reach value before talking to a rep.
Sales and success workflows: map the complete customer journey
Revenue teams that scale cleanly stop treating pre-sale and post-sale as separate systems. They manage one customer journey with clear handoffs, shared definitions, and measurable commitments on both sides.
- Awareness: Buyers recognize a problem and enter through inbound, outbound, partner, or referral channels.
- Education: Marketing and sales shape the problem, quantify impact, and establish why change matters now.
- Selection: Discovery, demo, proof of concept, proposal, negotiation, procurement, and closed-won or closed-lost.
- Onboarding: The customer moves from contract signature to implementation milestones and first value.
- Retention: Customer success tracks adoption, risk, value realization, and renewal readiness.
- Expansion: Teams identify additional use cases, cross-sell paths, executive sponsorship, and advocacy.
The Bowtie Model matters because it shifts the team from logo acquisition to recurring impact. Instead of optimizing only for closed-won, you optimize for first impact, recurring value, and expansion potential—usually the difference between flat retention and strong NRR.
Enforce sales process compliance across all deal stages
Forecast quality depends on process quality. If stage movement is subjective, Salesforce becomes a lagging narrative tool instead of an operational system.
- Set opportunity creation criteria. Define the minimum standard for opening an opportunity—confirmed pain, identified buyer, estimated contract value, and target timeline. This keeps junk pipeline out of forecast roll-ups.
- Define stage exit criteria. Each stage should have explicit requirements in Salesforce, backed by required fields, validation rules, and where needed, record-type logic by segment or opportunity type.
- Enable one sales methodology. MEDDIC, MEDDPICC, or another framework can work, but it needs field-level translation into Salesforce so inspection is possible.
- Run a weekly operating cadence. Pipeline reviews, commit reviews, and risk reviews should happen on a schedule that reps and managers can predict.
- Combine forecast methods. Use roll-up commits, stage-weighted views, manager judgment, and historical conversion patterns instead of relying on one forecast input.
- Inspect age and stagnation. Track days in stage, slipped close dates, missing next steps, and missing decision criteria.
Strict stage exit criteria are mandatory because pipeline bloat compounds quietly. Once too many deals move forward without proof of buyer engagement, coverage ratios look healthy on paper while forecast error, sales cycle length, and late-stage loss rates get worse.
Structure customer success to drive retention and expansion
Customer success teams at scale are not just support wrappers around the product. They are post-sale revenue operators responsible for adoption quality, renewal predictability, and expansion signal detection.
| Customer success stage | Recommended approach |
|---|---|
| Onboarding | Use a structured onboarding plan with milestone dates, named owners, success criteria, and time-to-value tracking. Automate repetitive tasks, but keep human ownership for strategic accounts. |
| Value impact | Translate adoption into business outcomes. Share ROI progress, benchmark usage, and tie product outcomes to the goals used during the sales cycle. |
| Up-sell and cross-sell | Use adoption gaps, stakeholder expansion, usage thresholds, and new team rollouts as expansion triggers. Make those triggers visible in account reviews. |
| Retention and renewals | Start renewal workflows 90-120 days before contract end. Monitor low usage, executive disengagement, support friction, and unresolved product blockers as risk signals. |
| Relationship management | Assign senior CSM coverage where account complexity or strategic value justifies it. Executive-to-executive relationships often decide the outcome in enterprise renewals. |
| Advocacy and feedback | Build references, referral loops, advisory boards, and structured feedback collection into the lifecycle instead of treating them as ad hoc asks. |
Modern CS teams are moving from reactive ticket handling to proactive revenue generation. The shift shows up in what they track: not only case volume and CSAT, but also time to first value, adoption depth, GRR, NRR, and expansion contribution to ARR.
RevOps roadblocks: solve the most common scaling challenges
Scaling problems usually hit in a predictable order. First, top-of-funnel efficiency weakens. Then conversion rates drop, forecast confidence erodes, and retention pressure shows up after the acquisition engine is already stressed.
| Scaling challenge | Operational response |
|---|---|
| Low pipeline coverage | Shift spend toward proven pipeline sources, improve MQL-to-SQO conversion, and test new channels or segments with clear success criteria. |
| Low win rates | Improve discovery quality, tighten qualification, strengthen objection handling, and isolate product gaps versus execution gaps. |
| Low quota attainment | Rework hiring profile, improve onboarding and manager inspection, and address underperformance faster. |
| High CAC payback | Audit channel efficiency, incentive design, and conversion leaks before adding budget. |
| High rep turnover | Define the ideal rep profile, compare top-performer patterns, and tighten sourcing and training. |
| Poor pipeline visibility | Automate activity capture, enforce qualification standards, and run consistent pipeline inspection. |
| Long sales cycles | Improve pain discovery, tie pain to measurable downside, and create urgency earlier in the process. |
| Inaccurate forecasting | Run weekly forecast cadence, standardize forecast categories, and combine multiple forecast methods. |
| Weak product-market fit in new segments | Run structured discovery, test pilots, and validate roadmap fit before scaling coverage. |
Fix pipeline coverage, low win rates, and quota attainment
- Pipeline coverage low: Reallocate spend toward channels that produce sales-accepted pipeline, not just MQL volume. If coverage is below plan, first inspect conversion by source and segment before asking marketing for more names.
- Win rates low: Improve discovery quality before changing close tactics. Teams that miss pain, decision criteria, or stakeholder dynamics early usually lose later for reasons that get mislabeled as pricing or competition.
- Quota attainment low: Separate capacity issues from talent issues. If ramp is slow, onboarding and manager coaching may be the problem; if variance between top and bottom reps is wide, your hiring profile may be off.
- Rep turnover high: Build the ideal rep profile from evidence. Look at prior environment, deal complexity, sales methodology fit, and how top performers actually work.
- Sales cycles too long: Tie the buyer’s problem to negative business impact and a timeline. Without urgency, enterprise deals drift into procurement purgatory or next-quarter status.
Throwing more leads at a low win-rate problem usually increases CAC without fixing the root cause. More top-of-funnel volume does not help if the team is qualifying weak opportunities, missing buying committee coverage, or failing to create urgency.
Automate manual processes to improve CRM data quality
At scale, manual CRM maintenance becomes an operating tax. Reps avoid updates, managers inspect partial data, and RevOps spends cycle time fixing Salesforce reports instead of improving the process that creates the data.
- Implement required fields and validation rules. Don’t leave core forecast fields optional. Close date, amount, next step, MEDDIC fields, loss reason, renewal risk, and implementation path should be enforced based on stage and record type.
- Automate activity capture and Salesforce write-back. Email, meetings, and call data should flow into Salesforce with clear field mapping and ownership logic. The goal is data completeness you can report on, not more admin work for reps.
- Standardize definitions across teams. Align what counts as an MQL, SQL, SQO, pipeline created, expansion opportunity, and churn event. If marketing, sales, and customer success use different definitions, your dashboards will disagree by design.
- Unify the customer journey across silos. Connect lead, opportunity, onboarding, product adoption, renewal, and expansion data in one reporting model. In Salesforce, that often means agreed object relationships, account hierarchy rules, and consistent stage mapping across custom objects.
- Automate forecast prep. Weekly forecast calls should not start with spreadsheet cleanup. Use rules-based inspection, stage hygiene checks, and activity completeness alerts before the meeting.
AI and revenue intelligence tools help here when they reduce manual entry at the source. For teams running Salesforce Enterprise or Unlimited editions, the practical question is not whether you have activity capture—it’s whether the activity sync is complete, mapped to the right records, and usable in pipeline inspection and forecast workflows.
That’s also why many RevOps teams revisit their conversation intelligence stack as they scale. If you’re migrating from Gong, the issue is usually not call recording quality—it’s shallow Salesforce field mapping, activity gaps, and manual workarounds that weaken reporting accuracy. Teams that move to Weflow, a Salesforce-native revenue AI platform, usually do it to improve Salesforce write-back, reduce integration footprint, and get deployment done in weeks, not quarters. The tradeoff is that you still need clean validation logic, clear ownership rules, and a reporting model that can support the full customer journey.
Performance benchmarks: track the metrics investors care about
As companies move toward $100M ARR, the metric mix changes. Early-stage teams can get away with optimizing for raw growth; later-stage teams are expected to balance growth, efficiency, retention, and profitability at the same time.
Monitor financial health and core investor metrics
| Metric | Definition | Target benchmark |
|---|---|---|
| Rule of 40 | YoY revenue growth rate plus EBITDA margin | Minimum >40%; good 40-60%; excellent >60% |
| Magic Number | Net new ARR divided by previous quarter sales and marketing spend | Minimum viable >0.75; good 1.0-1.5; excellent >1.5 |
| CAC payback period | CAC divided by ARPA multiplied by gross margin adjustment | SMB 6-12 months; mid-market 12-18 months; enterprise 18-24 months |
| LTV/CAC ratio | Customer lifetime value divided by customer acquisition cost | Minimum viable 3:1; good 4:1; excellent >5:1 |
| Net dollar retention | Revenue retained from existing customers including expansion | Mid-market 100-110%; enterprise >120%; top performers >130% |
| Gross dollar retention | Revenue retained from existing customers excluding expansion | Good >85%; great >90%; best-in-class >95% |
| Burn Multiple | Net burn divided by net new ARR | <1.5x is strong; >2x is a warning sign |
| Free cash flow margin | Operating cash flow minus CapEx, divided by revenue | Public SaaS median is about 10% |
| EBITDA margin | EBITDA divided by revenue | Public SaaS median about 6%; strong 20-30% |
| Gross margin | Revenue minus cost of goods sold, divided by revenue | Pure SaaS 80-85%; best-in-class >85% |
Earlier-stage companies are judged more heavily on growth rate. As you scale, investors scrutinize Burn Multiple, EBITDA, and free cash flow more closely because they want proof the GTM engine is efficient, not just active.
Measure marketing efficiency and sales pipeline velocity
- Marketing metrics: MQL to SQL conversion rate (15-30% for B2B SaaS), cost per MQL ($30-$100), MQL response time (best practice under one hour), visitor-to-lead conversion rate (2-5%, with top performers above 5%), and cost per acquisition by segment.
- Sales metrics: Pipeline coverage ratio (3-4x for enterprise, 5-6x for mid-market), pipeline velocity, win rate (20-30% overall; top performers above 35%), sales cycle length (SMB one to three months, mid-market three to six months, enterprise six to 12+ months), and sales capacity utilization (top performers above 60%).
- Productivity metrics: AE ramp time, SDR ramp time, quote-to-close ratio, and active opportunities per rep all help explain whether your headcount plan can actually produce the pipeline in your model.
Pipeline coverage requirements change by motion. Enterprise teams can often work with lower opportunity counts but need solid 3-4x coverage because cycles are longer and win rates lower; higher-volume motions need more opportunity throughput and tighter conversion control because individual deal value is smaller.
Track customer success metrics to protect recurring revenue
- Time to first value (enterprise: one to three months; faster is better) tracks how quickly a customer reaches a meaningful outcome after purchase.
- Product adoption rate (good: >60%; best-in-class: >80%) shows whether purchased capability is turning into actual usage.
- Customer churn rate (enterprise: <1% monthly; best-in-class: <5% annually) measures logo loss.
- Revenue churn rate (enterprise: <5% annually; negative churn is ideal) shows how much recurring revenue is shrinking even before expansion is counted.
- Net revenue retention (NRR) (good: >100%; great: >110%; best-in-class: >120%) includes expansions, contractions, and churn.
- Gross revenue retention (GRR) (good: >85%; great: >90%; best-in-class: >95%) excludes expansion and shows how much core recurring revenue you kept.
- Expansion revenue contribution (healthy: 20-30% of total revenue; best-in-class: >40%) shows how much growth is coming from the installed base.
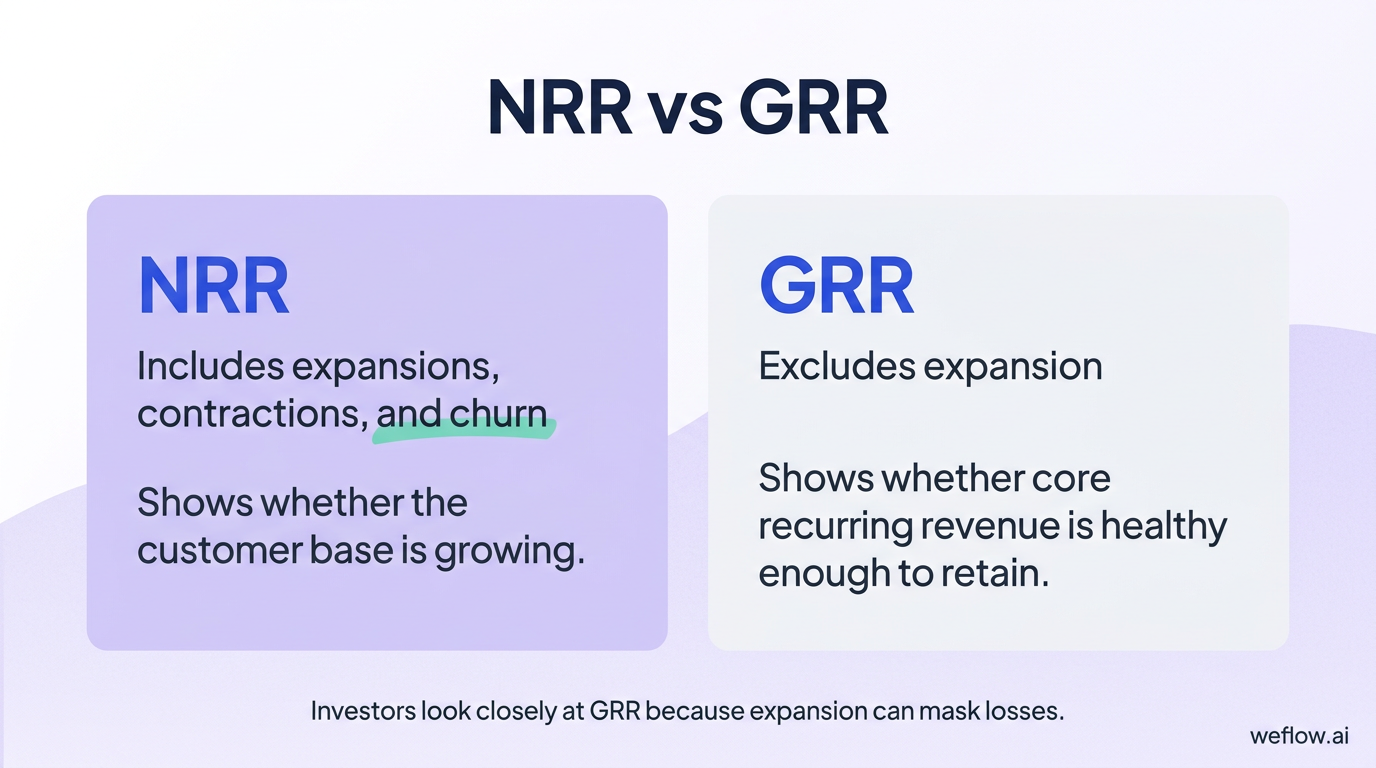
NRR and GRR answer different questions. NRR tells you whether the customer base is growing after upsell and cross-sell; GRR tells you whether the core product is healthy enough to retain revenue before expansion masks the losses. Investors look closely at GRR for that reason.
FAQ
What is the Rule of 40 in B2B SaaS growth?
The Rule of 40 is the sum of your YoY revenue growth rate and EBITDA margin, and the combined result should be above 40%. For later-stage SaaS companies, it’s a shorthand test for whether growth and profitability are balanced well enough to support valuation.
How do you calculate the CAC payback period?
CAC payback period is calculated as CAC divided by ARPA multiplied by gross margin adjustment: CAC / (ARPA × Gross Margin). A common benchmark for mid-market B2B SaaS is 12-18 months, while enterprise models can sustain 18-24 months if retention and expansion are strong.
What is a healthy net revenue retention rate?
A healthy NRR is above 100%, which means your existing customer base is growing even after churn and contraction. For enterprise SaaS, more than 120% is usually viewed as top-tier performance because it shows strong expansion on top of solid retention.
How long should an enterprise sales cycle take?
Enterprise sales cycles usually take six to 12+ months because they involve multiple stakeholders, security review, procurement, and budget approval. By comparison, SMB cycles often close in one to three months because buying committees are smaller and implementation risk is lower.
.webp)

.webp)
.webp)

.webp)
.webp)
.webp)
.webp)

.webp)