

RevOps Metrics and Models to Track Revenue Performance Across Every GTM Team [Cheat Sheet]
Revenue Operations, or RevOps, is the strategic alignment of sales, marketing, customer success, and finance to optimize the full revenue lifecycle. Done well, it gives your CRO, CFO, and GTM leaders one operating system for process, data, systems, and decision-making.
This guide turns a cheat sheet into a working reference. You’ll get the core RevOps operating models, maturity frameworks, tech stack categories, and the exact metrics most teams track as they scale.
[banner type="download" url="https://www.weflow.ai/content/revops-cheat-sheet" text="RevOps Cheat Sheet" subtitle="Get the core definition, alignment framework, workflow checklist, and forecasting essentials." button="Download now"]RevOps operating models: align teams to scale revenue
RevOps exists to remove the handoff gaps that show up between lead generation, pipeline management, closed-won execution, renewals, and expansion. The goal isn’t to create another layer of reporting. It’s to make revenue performance more predictable by giving every GTM team shared process, trusted data, and clear ownership.
| Operating model layer | Description |
|---|---|
| Strategy & planning | Turns revenue targets into headcount plans, budgets, campaigns, territories, quotas, and forecast models. |
| Enablement | Trains teams on process, playbooks, systems, and inspection cadence so managers can enforce the same way of working. |
| Data & analytics | Captures activity, opportunity, account, and customer data, then turns it into dashboards, scorecards, and board-ready reporting. |
| Tools & automations | Translates GTM process into systems, field mapping, workflow rules, integrations, and Salesforce write-back logic. |
| Operations & processes | Defines the lead-to-revenue lifecycle, stage exit criteria, ownership rules, routing, approvals, and handoffs across teams. |
Most high-performing RevOps teams report into the CRO because that structure reduces cross-functional friction. When sales ops, marketing ops, customer success ops, and business systems work from one revenue plan instead of separate departmental priorities, data definitions stay tighter, pipeline handoffs break less often, and forecast discussions stop turning into reconciliation projects.
Map the five core functions of RevOps
These five functions work together. If one breaks, revenue leaks show up somewhere else—usually as poor pipeline hygiene, activity gaps in Salesforce, low forecast confidence, or conflicting board numbers.
- Strategy: Own forecasting models, capacity planning, territory design, pricing support, discount governance, renewal planning, and expansion analysis.
- Process optimization: Improve lead routing, stage progression, approval flows, handoffs, QBR workflows, and recurring revenue motions through automation and tighter operating rules.
- Data & analytics: Build the single source of truth for pipeline coverage, activity completeness, conversion rates, churn, NRR, and forecast error rate.
- Systems: Own Salesforce, marketing automation, CPQ, billing, BI, integrations, custom objects, validation rules, and change management across the GTM stack.
- Cross-team alignment: Set shared KPIs, shared definitions, shared reporting cadences, and clear accountability across sales, marketing, CS, finance, and executive leadership.
Structure your RevOps organization chart
A standard RevOps reporting structure usually sits under the CRO, with FP&A partnering from the CFO organization. The split matters: RevOps owns operational truth inside the revenue engine, while FP&A translates that into company-level planning, cash expectations, and investor reporting.
- CRO
- Customer Success
- Marketing
- Sales
- Revenue Operations
- CS Ops
- Marketing Ops
- Sales Ops
- Enablement
- Data & Analytics
- Strategy & Planning
- Business Systems
- Pricing & Deal Desk
- CFO
- FP&A
In practice, RevOps and FP&A should use the same revenue definitions but answer different questions. RevOps handles commit accuracy, pipeline inspection, stage-by-stage conversion, and activity-driven forecast inputs; FP&A handles plan variance, cash implications, and scenario modeling for the board.
RevOps maturity stages: benchmark your growth engine
Not every company needs the same RevOps design. A 30-person SaaS company needs clean journey capture and basic reporting. A public company needs forecast accuracy within a narrow range, formal governance, and process discipline across a much larger Salesforce footprint.
Assess your current RevOps maturity level
| Stage | Typical company size | Primary goals | Current priorities |
|---|---|---|---|
| Foundational | Seed to Series A 20–50 FTEs |
Measure the customer journey end to end. | Capture lifecycle stages, define basic ownership, hire the first ops generalist, and create baseline reporting. |
| Developing | Series A–B 50–120 FTEs |
Align marketing, sales, and CS on one GTM model. | Break silos, standardize funnel definitions, tighten lead routing, and establish end-to-end KPIs. |
| Aligned | Series B–D 120–250 FTEs |
Build an efficient, predictable revenue engine. | Improve forecast confidence, fix conversion gaps, reduce manual reporting work, and increase data completeness. |
| Scaled | Series D+ 250+ FTEs |
Improve efficiency and predictability as GTM complexity grows. | Simplify systems, strengthen governance, add advanced analytics, and run strategic cross-functional programs. |
| Advanced | Public 1,500+ FTEs |
Optimize the revenue engine for investor metrics and execution accuracy. | Drive forecast accuracy toward +/-2%, maintain top-tier GTM benchmarks, and build a specialized RevOps team. |
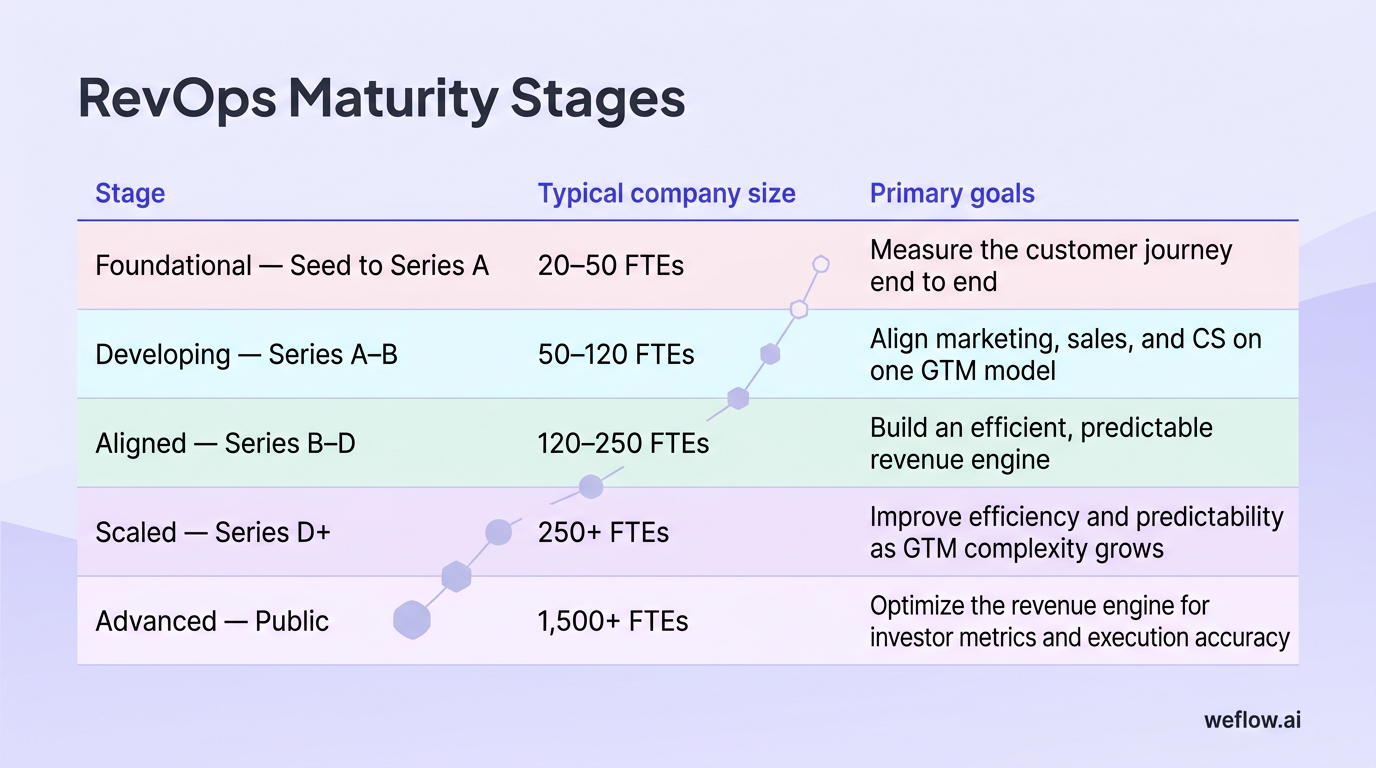
The shift in priorities is straightforward. Early-stage teams need to capture the journey at all—who entered, who converted, who churned, and where data is missing. Later-stage teams already have volume, so the work moves to forecast precision, operating efficiency, and audit-ready reporting.
You can use this model to pick your next hire or project. If you’re in the Foundational or Developing stage, the next move is usually a strong Salesforce admin or RevOps generalist. If you’re in Aligned or Scaled, the next move is often a systems owner, analyst, or forecasting lead who can improve process control and data integrity.
Track the customer journey with the Bowtie model
The traditional funnel stops at the deal. The Bowtie model is more useful for SaaS because recurring revenue depends just as much on onboarding, retention, and expansion as it does on first-time conversion.
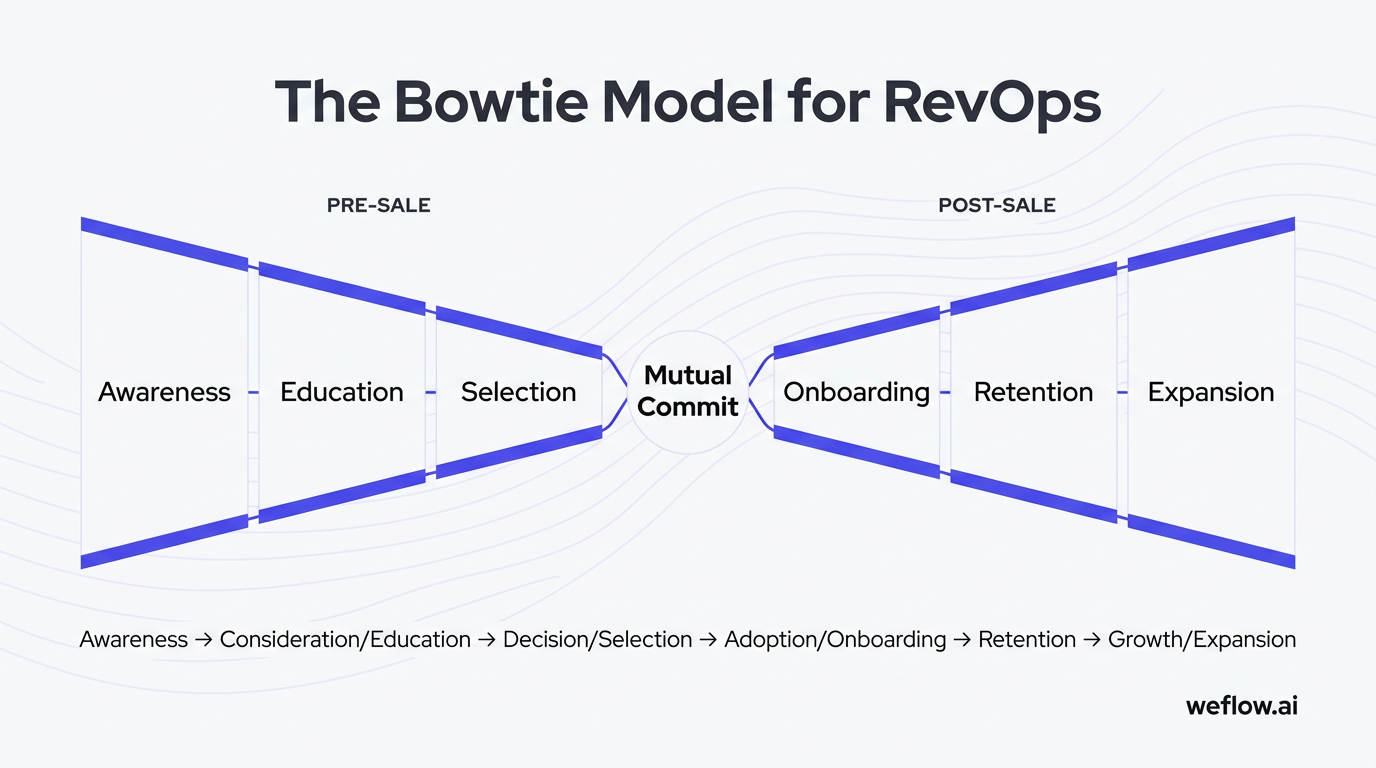
- Awareness — the buyer recognizes a gap or missed outcome. This is where you identify missing impact.
- Education — the buyer understands the problem in more detail and starts to see the cost of inaction. This is where negative impact becomes clearer.
- Selection — the buyer evaluates options and prioritizes which business impact is worth solving now.
- Mutual Commit — both sides agree on expected outcomes, timeline, and buying criteria. This is the commitment point on the left side of the bowtie.
- Onboarding — the customer reaches first impact. For most SaaS teams, this is the first post-sale milestone RevOps should measure tightly.
- Retention — the customer gets recurring impact through sustained product usage, stable support, and measurable business value.
- Expansion — the customer reaches maximum impact through upsell, cross-sell, additional seats, or broader rollout.
Mapped to a standard lifecycle, the sequence looks like this: Awareness → Consideration/Education → Decision/Selection → Adoption/Onboarding → Retention → Growth/Expansion.
The Bowtie model is stronger than a funnel for recurring revenue businesses because it keeps post-sale performance in the same operating view as pre-sale conversion. That lets RevOps connect low time-to-first-value, weak product adoption, or support delays to later NRR and GRR outcomes instead of treating them as separate CS issues.
RevOps tech stack: build a single source of truth
Your tech stack should support clean process execution, not create another reporting layer to reconcile. Before buying anything new, audit your Salesforce data model, standard and custom objects, required fields, validation rules, activity sync behavior, API usage, and integration footprint. Most reporting problems start there.
- CRM: Usually Salesforce for mid-market and enterprise B2B organizations. This is the system of record for accounts, contacts, opportunities, activities, forecast categories, and revenue process enforcement.
- Marketing automation: Handles scoring, nurture logic, campaign attribution, form capture, routing triggers, and handoff into Salesforce.
- CPQ & billing: Supports product catalog management, pricing controls, quote generation, approval workflows, subscription logic, and revenue recognition inputs.
- Analytics & BI: Pulls data from Salesforce, billing, product, and support sources into dashboards for pipeline, retention, capacity, and board reporting.
- Additional categories: Revenue intelligence, sales engagement, activity capture, enrichment, support systems, and product analytics all matter—but only after the core system design is stable.
For Salesforce teams, the order matters. If account ownership is messy, stage definitions are loose, or activity write-back is incomplete, adding more tools won’t improve decision quality. It usually adds more sync logic to debug.
Audit your core systems and integrations
| Platform | What to audit | Required capabilities | Failure signals |
|---|---|---|---|
| CRM | Object model, required fields, stage definitions, owner rules, account hierarchies, custom objects, validation rules, activity capture, forecast categories | Clean data structure, high rep adoption, usable reports, reliable Salesforce write-back, support for Enterprise/Unlimited editions | Low activity completeness, stale opportunities, duplicate accounts, inconsistent close dates, manual forecast updates |
| Marketing automation | Lead scoring, routing rules, campaign taxonomy, handoff SLAs, deliverability, lifecycle stages | Consistent scoring, fast routing, clear attribution, strong sync with Salesforce leads and contacts | High MQL volume but low SAL acceptance, slow response time, broken campaign reporting |
| CPQ & billing | Product catalog, approval flows, quote templates, pricing logic, term handling, renewals, billing handoff | Accurate quote generation, discount controls, clean contract data, renewal visibility | Manual pricing exceptions, approval bottlenecks, poor renewal forecast inputs, mismatched contract values |
| Analytics & BI | Source systems, transformation logic, dashboard definitions, refresh schedules, metric ownership | Reliable executive dashboards, reusable data models, version control on definitions, clear source lineage | Different numbers in Salesforce and BI, long reporting cycles, unclear metric definitions, limited trust from leadership |
Quick audit tip: check Salesforce user adoption by role, not just overall login rates—AEs, SDRs, managers, and CSMs use different objects and should each have their own data completeness baseline.
Categorize tools by go-to-market function
- Marketing: Marketing automation, ABM platforms, ad platforms, website and landing page tools, content systems, and conversion optimization tools.
- Prospecting: Routing and scheduling, list building, enrichment, signal orchestration, AI SDR agents, and outbound engagement platforms.
- Sales: Forecasting and reporting, revenue intelligence, conversation intelligence, enablement, compensation, CPQ, signature tools, and sales engagement.
- Customer success: CS platforms, support systems, project management, chat, AI note capture, and product adoption tooling.
- Infrastructure: Foundational LLMs, ETL tools, reverse ETL, data warehouses, product analytics, and BI.
AI agents and LLMs are starting to change the RevOps infrastructure layer, but they don’t replace system design. They’re most useful when the underlying Salesforce schema, field mapping, and permission model are already clean enough for reliable automation.
Financial and growth metrics: report to your board
Board reporting usually mixes three metric groups: efficiency metrics for fundraising and valuation, recurring revenue growth metrics for operating pace, and financial health metrics for planning risk. RevOps doesn’t own every number, but it usually owns the data quality that makes those numbers defensible.
| Metric | Definition | Benchmark |
|---|---|---|
| Rule of 40 | YoY revenue growth rate + EBITDA margin | Minimum target: >40%; good: 40–60%; excellent: >60% |
| Magic Number | Net New ARR / previous quarter sales and marketing spend | Minimum viable: >0.75; good: 1.0–1.5; excellent: >1.5 |
| CAC payback period | CAC / (ARPA × gross margin) | SMB: 6–12 months; mid-market: 12–18 months; enterprise: 18–24 months |
| LTV/CAC ratio | Customer lifetime value divided by acquisition cost | Minimum viable: 3:1; good: 4:1; excellent: >5:1 |
| Net dollar retention | (Beginning MRR + expansions − contractions − churn) / beginning MRR × 100 | SMB: 90–100%; mid-market: 100–110%; enterprise: >120%; top performers: >130% |
| Gross dollar retention | Recurring revenue retained from existing customers, excluding expansions | Good: >85%; great: >90%; top tier: >95% |
| Burn multiple | Net burn / Net New ARR | <1.5x is strong; >2x is concerning |
| Free cash flow margin | (Operating cash flow − CapEx) / revenue × 100 | Early-stage median can be deeply negative; public SaaS median is around 10% |
| EBITDA margin | EBITDA / revenue × 100 | Public SaaS median: around 6%; strong: 20–30% |
| ARR | Normalized annual value of active recurring subscriptions | Seed: $0.2–1M; Series A: $1–3M; Series B: $5–20M; growth stage: $20M+ |
| MRR | Predictable monthly recurring subscription revenue | Early-stage monthly growth: 10–15%; growth stage: 5–7% |
| YoY growth rate | ((Current period − prior period) / prior period) × 100 | Early-stage: 3x+3x+2x+2x; growth stage: 40–100%; public SaaS median: around 30% |
| QoQ growth rate | ((Current quarter − previous quarter) / previous quarter) × 100 | Early-stage: 15–25%; growth stage: 10–15%; scale stage: 5–10% |
| Logo growth rate | Net increase in paying customers over a period | Early-stage: >10% monthly; growth stage: 3–5% monthly; enterprise: 1–2% monthly |
| Burn rate | Monthly net cash outflow | Should not exceed 1/12 of the last funding round; pair with burn multiple for context |
| Runway | Current cash balance / monthly burn rate | Minimum: 12 months; ideal: 18–24 months; uncertain markets: 24–36 months |
| Gross margin | (Revenue − COGS) / revenue × 100 | Infrastructure SaaS: 65–75%; pure SaaS: 80–85%; top tier: >85% |
| Operating expense ratio | Total operating expenses / revenue | Early-stage: 150–200%; growth: 100–150%; scale: 60–80%; mature: 40–60% |
For fundraising, investors usually focus first on growth efficiency: Rule of 40, Magic Number, burn multiple, NDR, and CAC payback. For internal planning, leadership usually cares more about ARR quality, forecast range, runway, operating expense ratio, and whether growth is sustainable across segments.
Calculate investor metrics for valuation
- Rule of 40
- Formula: YoY revenue growth rate + EBITDA margin. Target: above 40% is healthy, 40–60% is solid, and above 60% is strong. Early-stage companies usually lean on the growth side of the equation; later-stage companies are expected to balance growth with better profitability.
- Magic Number
- Formula: Net New ARR / previous quarter sales and marketing spend. Target: above 1.0 signals efficient GTM spend, while below 0.75 usually means acquisition efficiency needs work.
- CAC payback period
- Formula: CAC / (ARPA × gross margin). Target: under 12 months is strong, 12–18 months is common in mid-market, and enterprise can extend to 18–24 months because deal sizes are larger.
- LTV/CAC ratio
- Formula: LTV / CAC. Target: 3:1 is the minimum most operators want to see, 4:1 is healthy, and above 5:1 is strong.
- Net dollar retention
- Formula: (Beginning MRR + expansions − contractions − churn) / Beginning MRR × 100. Target: 90–100% in SMB, 100–110% in mid-market, and above 120% in enterprise. The highest-performing SaaS companies often clear 130%.
- Gross dollar retention
- Formula: Retained recurring revenue from the existing book, excluding expansions. Target: above 85% is good and above 95% is top tier.
- EBITDA margin
- Formula: EBITDA / revenue × 100. Target: public SaaS median sits near 6%, while stronger operators push into the 20–30% range.
- Free cash flow margin
- Formula: (Operating cash flow − CapEx) / revenue × 100. Target: early-stage teams can be materially negative, but mature public SaaS businesses often target positive double digits.
Monitor growth rates across recurring revenue
- ARR: The normalized annual value of recurring subscriptions. Typical stage markers are roughly $0.2–1M at Seed, $1–3M at Series A, $5–20M at Series B, and $20M+ in growth stage.
- MRR: The predictable monthly value of recurring subscriptions. Early-stage companies often target 10–15% monthly growth; later-stage teams usually operate closer to 5–7%.
- YoY growth rate: Formula: ((Current period − Prior period) / Prior period) × 100. Early-stage expectations often follow the rough 3x+3x+2x+2x pattern, then compress toward 40–100% in growth stage and around 20–40% at scale.
- QoQ growth rate: Formula: ((Current quarter − Previous quarter) / Previous quarter) × 100. A healthy range is often 15–25% early, 10–15% in growth stage, and 5–10% at scale.
- Logo growth rate: Formula: ((End customers − Start customers) / Start customers) × 100. Early-stage companies may add more than 10% net logos monthly, while enterprise motions often land closer to 1–2% because ACV is larger and cycles are longer.
Exclude one-time fees, services revenue, and non-recurring implementation charges from ARR. If you don’t, your recurring revenue base looks stronger than it is and your forecast model starts drifting away from cash reality.
Evaluate financial health and cash runway
| Metric | Early-stage benchmark | Mature benchmark |
|---|---|---|
| Burn rate | Can run higher while searching for product-market fit, but should still be measured against last funding raised | Expected to be tighter, with stronger burn multiple discipline and less tolerance for inefficient spend |
| Runway | 18–24 months is usually the safer planning range | 24–36 months becomes more common when markets tighten or capital is expensive |
| Cash conversion cycle | Monthly contracts often create a 30–60 day cycle | Annual upfront contracts can create a negative cash conversion cycle, which improves resilience |
| Gross margin | 65–75% for infrastructure-heavy models, 80–85% for pure SaaS | Top operators often hold above 85% |
| Operating expense ratio | Often 150–200% of revenue | Often 40–60% of revenue |
Runway targets shift with market conditions. In easy funding environments, 18 months may be enough. In uncertain markets, most operators want 24–36 months so GTM plans don’t depend on perfect execution or fast access to new capital.
Go-to-market metrics: optimize the revenue lifecycle
RevOps uses department-level KPIs to find the specific point where revenue slows down. If marketing volume looks fine but sales acceptance is low, the issue is probably lead quality or routing. If sales closes well but NRR lags, the gap is post-sale adoption or expansion execution.
- Marketing metrics: MQL to SQL conversion, MQL response time, cost per MQL, CPC, CPA, website conversion rate, bounce rate, and traffic mix.
- Sales metrics: Pipeline coverage, pipeline velocity, win rate, average deal size, sales cycle length, ramp time, capacity utilization, and daily activity levels.
- Customer success metrics: Time to first value, product adoption, NPS, CSAT, churn, NRR, GRR, support resolution time, and expansion revenue.
Measure marketing pipeline and acquisition costs
| Metric | Benchmark |
|---|---|
| MQL to SQL conversion rate | 15–30% in B2B SaaS |
| MQL response time | Less than 1 hour |
| Cost per MQL | $30–$100 |
| Lead scoring effectiveness | More than 60% of MQLs should convert to SALs |
| MQL growth rate | 10–20% YoY is a healthy range |
| Visitors to lead conversion rate | 2–5%; top performers clear 5% |
| Bounce rate | 40–60% for B2B websites |
| Time on site | More than 2–3 minutes; above 4 minutes is strong |
| CPC | Google Ads: $2–$7; LinkedIn: $5–$15; Facebook: $1–$3 |
| CPA | SMB: $100–$500; mid-market: $500–$2,000; enterprise: $2,000–$10,000+ |
Lead scoring quality shows up quickly in sales acceptance rates. If MQL volume is rising but SAL conversion is weak, the issue usually isn’t SDR discipline—it’s scoring logic, routing rules, or campaign targeting.
Track sales velocity and pipeline coverage
- Pipeline coverage ratio
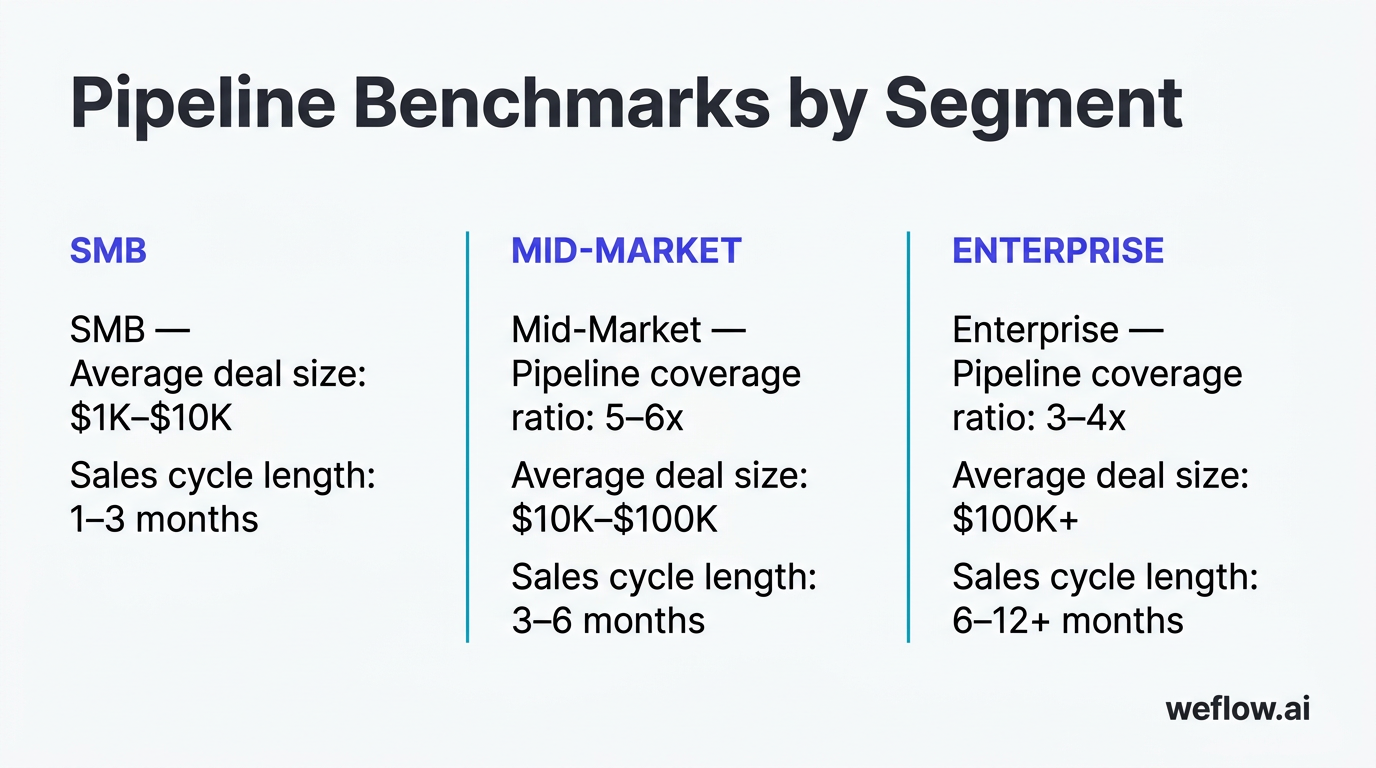
- Formula: total pipeline value / revenue target for the period. Benchmark: around 5–6x for many mid-market teams and 3–4x for enterprise teams with better qualification and larger ACV. Coverage requirements rise as sales cycles get longer because more deals slip across periods.
- Pipeline velocity
- Formula: (Number of deals × average deal size × win rate) / sales cycle length. Benchmark: velocity varies by segment, but a healthy pipeline usually has fewer than 20% of deals sitting stagnant.
- Win rate
- Benchmark: 20–30% overall in B2B SaaS, above 35% for top teams, and often 15–25% in enterprise because buying groups are larger and cycles are harder to control.
- Average deal size
- Benchmark: SMB often lands between $1K and $10K, mid-market between $10K and $100K, and enterprise above $100K.
- Sales cycle length
- Benchmark: SMB: 1–3 months; mid-market: 3–6 months; enterprise: 6–12+ months.
- SQL conversion rate
- Benchmark: 20–30% for well-qualified leads, with stronger teams pushing above 35%.
- Sales productivity ramp time
- Benchmark: SDRs: 3–4 months; AEs: 6–9 months; enterprise AEs: 9–12 months.
- Sales capacity utilization
- Benchmark: top teams keep more than 60% of rep time on selling activities; many teams sit closer to 35–45%.
- Quote to close ratio
- Benchmark: 20–30% is common; above 40% is strong.
- Daily sales activity metrics
- Benchmark: SDRs often target 30–50 calls and 50–75 emails per day. AEs may target 15–20 calls, 20–30 emails, 2–3 meetings per day, and 15–30 active opportunities depending on ACV and segment.
Analyze customer success and retention rates
- Time to first value: SMB should usually reach value in days to weeks; enterprise often lands in one to three months. This is one of the earliest indicators of later GRR performance.
- Product adoption rate: More than 60% is a healthy floor, and above 80% is strong for purchased features or modules.
- Core feature usage: Core features should be used by more than 80% of customers; secondary features often sit above 40%.
- NPS: 30–40 is common in B2B SaaS; above 50 is strong.
- CSAT: 75–85% is healthy; above 90% is strong.
- Support resolution time: First response should usually be under four hours, and full resolution under 24 hours for standard issues.
- Customer churn rate: SMB often runs at 3–5% monthly; enterprise should stay under 1% monthly. The strongest teams keep annual churn under 5%.
- Revenue churn rate: SMB often lands around 5–7% annually; enterprise should stay under 5% annually.
- NRR: Above 100% is healthy, above 110% is strong, and above 120% is top tier.
- GRR: Above 85% is healthy, above 90% is strong, and above 95% is top tier.
- CLV: A useful rule is 3x–5x CAC.
- Expansion revenue: Many healthy SaaS companies get 20–30% of revenue from expansion; top performers can exceed 40%.
Time to first value matters because customers who reach an early outcome adopt more, stay longer, and expand more often. If TTFV slips, GRR usually weakens a few quarters later.
RevOps education resources: upskill your operations team
Start with your own CRM before chasing advanced certifications. If you can’t explain your Salesforce object model, forecast category logic, lead lifecycle, and activity sync gaps, external frameworks won’t fix the operating issues that matter most.
- Communities and certifications: Useful for benchmarking process design, career development, and solving edge-case workflow problems.
- Books and podcasts: Useful for sharpening operating judgment, learning how other RevOps leaders structure teams, and improving executive communication.
- Benchmark reports: Useful for checking whether your KPIs are actually strong for your segment and stage.
- Tactical cheat sheets: Useful when you need a working template for forecasting, data hygiene, onboarding, QBRs, or pipeline inspection.
Bookmark top communities, books, and podcasts
- Communities
- RevOps Co-op
- Pavilion
- HubSpot Academy Revenue Operations Certification
- Salesforce Trailblazer Community
- Winning by Design
- Books
- The Operations Manual by Sean Lane
- Revenue Architecture by Jacco van der Kooij
- The Sales Acceleration Formula by Mark Roberge
- The Challenger Sale by Matthew Dixon and Brent Adamson
- The Qualified Sales Leader by John McMahon
- High Output Management by Andrew Grove
- Podcasts
- Revops Lab
- Operations
- RevOps FM
- RevOps Review
- Science of Scaling
- RevOPs AF
- Reports
- Gartner RevOps research
- Forrester research on RevOps
- RepVue Cloud Sales Index
- ICONIQ, Bessemer, and Index GTM benchmark reports
- Weflow, a Salesforce-native revenue AI platform, also publishes RevOps salary reports that are useful for team design and hiring benchmarks.
A good community often solves niche tech-stack issues faster than vendor support because the advice comes from operators who’ve already worked through the same Salesforce config, routing logic, or reporting problem in production.
Download tactical cheat sheets and templates
| Resource topic | Description |
|---|---|
| Activity capture | Use this when you need to understand Salesforce activity design, capture gaps, and the tradeoffs between different sync approaches. |
| Salesforce data hygiene | Use this to clean records, tighten validation logic, improve required-field completion, and make pipeline reporting more trustworthy. |
| Pipeline visibility | Use this to inspect slippage risk, stage aging, stale deals, and forecast blind spots before the weekly call. |
| Deal and account execution | Use this to improve deal inspection, account planning, and manager coaching against live opportunities. |
| Sales forecasting | Use this to tighten forecast categories, inspection cadence, commit logic, and scenario planning. |
| Sales methodologies | Use this to standardize qualification, exit criteria, and manager coaching across teams and regions. |
| RevOps onboarding | Use the 30-60-90-day roadmap if you’re stepping into a new RevOps leadership role and need a structured plan for fast impact. |
| B2B GTM strategy | Use this to review revenue design across segmentation, pricing, pipeline creation, expansion, and operating cadence. |
| Revenue cadence | Use this to define the right meeting rhythm, participants, and inspection questions for forecast and pipeline reviews. |
| QBR templates | Use these to prepare data-backed quarterly reviews with consistent KPIs, storylines, and action items. |
FAQ
What is the Rule of 40 in SaaS?
The Rule of 40 adds your YoY revenue growth rate and EBITDA margin. A healthy SaaS company should land above 40%, with 40–60% viewed as solid and anything above 60% viewed as strong.
How do you calculate the SaaS magic number?
The Magic Number is Net New ARR divided by the previous quarter’s sales and marketing spend. A result above 1.0 usually means GTM spend is efficient, while anything below 0.75 is a warning sign.
What is a healthy net dollar retention rate?
Healthy NDR depends on segment: SMB often lands around 90–100%, mid-market around 100–110%, and enterprise above 120%. Top-performing SaaS companies often exceed 130% by driving strong expansion revenue.
How long should a CAC payback period be?
Best-in-class CAC payback is under 12 months. Mid-market often runs 12–18 months, and enterprise can stretch to 18–24 months because ACV is larger and the payback profile is different.
What is the difference between ARR and MRR?
ARR is the normalized annual value of recurring subscription revenue, while MRR is the predictable monthly recurring amount. MRR is usually ARR divided by 12, and both should exclude one-time fees and services revenue.
.webp)

.webp)
.webp)

.webp)

.webp)
.webp)
.webp)

.webp)