

COO Cheat Sheet: Build Predictable B2B Growth With Clear Operating Cadences [Framework]
The COO sits between strategy and execution. The job isn’t to create more activity—it’s to turn company goals into a repeatable operating cadence that produces durable growth, clean decisions, and fewer surprises.
That only happens when the business runs on a documented operating system, not heroic effort. This framework covers the core outcomes, operating cadences, decision rules, and data governance a B2B COO needs to make growth more predictable.
COO role foundations: define scope and drive durable growth
The B2B COO owns the system that helps the company plan, execute, inspect, and adjust. Success usually shows up in five outcomes: durable growth, efficiency, predictability, customer experience, and risk control.
Predictability is usually the hardest one. A revenue plan only holds when pipeline quality, sales execution, product readiness, onboarding capacity, renewal motions, and financial guardrails stay aligned across teams. One weak handoff can break the forecast.
| Outcome | Definition | Guardrail metrics |
|---|---|---|
| Durable growth | New and expansion revenue that holds over time, not one-off bookings that churn back out. | NRR, GRR, win rate, upsell rate, churn rate |
| Efficiency | Growth at improving unit economics, with headcount and spend tied to proof. | CAC payback, gross margin, sales productivity, pipeline generation per rep |
| Predictability | The ability to plan, forecast, and deliver within a tight range for multiple quarters. | Forecast accuracy, pipeline coverage, sales cycle length, stage conversion |
| Customer experience | A low-friction path from signed deal to adoption, expansion, and renewal. | Time-to-first-value, activation rate, adoption rate, expansion rate |
| Risk and compliance | Reliable operations with clear controls, low incident impact, and fast recovery when issues happen. | MTTR, audit findings, SLA breaches, critical vendor count |
Two failures show up early in most operating models:
- Metric sprawl: The CEO, CRO, CFO, and RevOps team all show different ARR or pipeline numbers. The 30-day fix is simple: publish a one-page KPI dictionary, freeze new executive metrics, and audit every dashboard against the same definitions.
- Status theater: Meetings become narrative updates instead of decisions. The 30-day fix is to require every recurring review to show plan, actual, variance, root cause, owner, and next decision.
Map core outcomes to guardrail metrics
Guardrail metrics matter because they tell you when growth is healthy and when it’s just expensive. A COO doesn’t need more dashboards—they need a small set of numbers that tie operating decisions to business health.
- Durable growth: NRR, GRR, win rate, logo churn, and expansion rate show whether revenue sticks.
- Efficiency: CAC payback, gross margin percentage, ARR per FTE, and sales productivity show whether spend turns into gross-profit-backed growth.
- Predictability: Forecast accuracy, pipeline coverage, pipeline velocity, time in stage, and cycle time show whether the revenue engine is stable enough to call the quarter with confidence.
- Customer experience: Time-to-first-value, on-time activation, adoption rate, and support MTTR show whether post-sale execution helps or hurts retention.
- Risk and compliance: Incident count, audit issues, vendor concentration, and SLA breaches show where operating risk is building.
CAC payback is the gatekeeper for hiring because it tells you how quickly the company gets its sales and marketing investment back in gross profit terms. If payback is getting longer, adding more headcount usually compounds the problem—you’re scaling an inefficient motion instead of fixing it.
Set boundaries across ten operational areas
The COO has broad range, but not unlimited range. Clear boundaries are what keep the role useful instead of political.
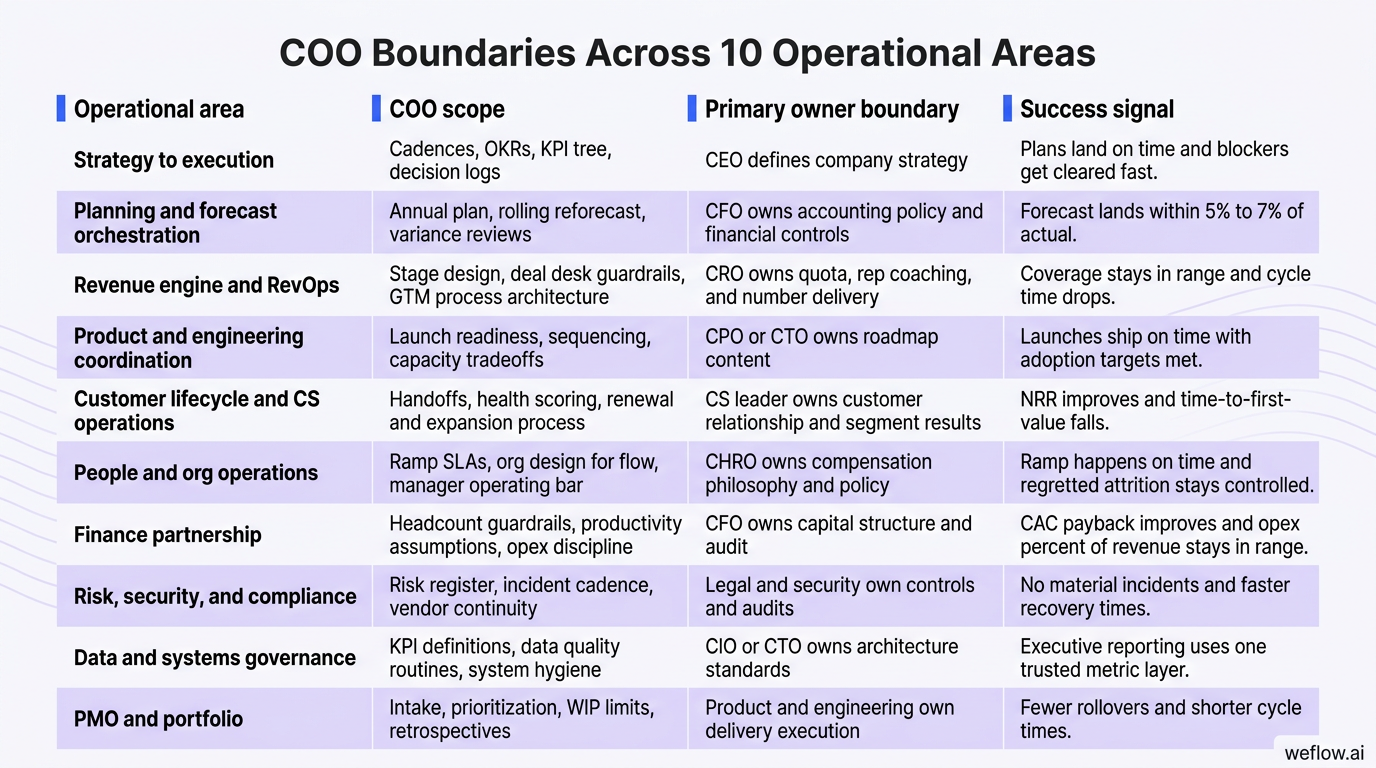
| Operational area | COO scope | Primary owner boundary | Success signal |
|---|---|---|---|
| Strategy to execution | Cadences, OKRs, KPI tree, decision logs | CEO defines company strategy | Plans land on time and blockers get cleared fast |
| Planning and forecast orchestration | Annual plan, rolling reforecast, variance reviews | CFO owns accounting policy and financial controls | Forecast lands within 5% to 7% of actual |
| Revenue engine and RevOps | Stage design, deal desk guardrails, GTM process architecture | CRO owns quota, rep coaching, and number delivery | Coverage stays in range and cycle time drops |
| Product and engineering coordination | Launch readiness, sequencing, capacity tradeoffs | CPO or CTO owns roadmap content | Launches ship on time with adoption targets met |
| Customer lifecycle and CS operations | Handoffs, health scoring, renewal and expansion process | CS leader owns customer relationship and segment results | NRR improves and time-to-first-value falls |
| People and org operations | Ramp SLAs, org design for flow, manager operating bar | CHRO owns compensation philosophy and policy | Ramp happens on time and regretted attrition stays controlled |
| Finance partnership | Headcount guardrails, productivity assumptions, opex discipline | CFO owns capital structure and audit | CAC payback improves and opex percent of revenue stays in range |
| Risk, security, and compliance | Risk register, incident cadence, vendor continuity | Legal and security own controls and audits | No material incidents and faster recovery times |
| Data and systems governance | KPI definitions, data quality routines, system hygiene | CIO or CTO owns architecture standards | Executive reporting uses one trusted metric layer |
| PMO and portfolio | Intake, prioritization, WIP limits, retrospectives | Product and engineering own delivery execution | Fewer rollovers and shorter cycle times |
The biggest boundary risk is the COO becoming a shadow CRO. That usually happens when forecast pressure rises and the COO starts managing deals instead of the system. Avoid it by keeping one rule in place: the COO owns the inspection cadence, stage rules, and capacity model, while the CRO owns rep behavior, coaching, commits, and quota attainment.
Identify your specific operational archetype
Not every COO has the same center of gravity. The company’s motion determines which version of the role matters most.
| Archetype | Core reports | Best fit | Primary risk |
|---|---|---|---|
| GTM Ops-led COO | RevOps, CS Ops, PMO, Business Systems | Sales-led growth with multiple segments and regions | Overlap with the CRO on execution ownership |
| Delivery and customer ops COO | Implementation, support operations, CS Ops | Complex onboarding and enterprise deployments | Underinvesting in pipeline generation discipline |
| Platform and corporate ops COO | BizOps, analytics, IT, vendor management, risk program | Late-stage scale, compliance, and multi-system complexity | Decision speed slowing under process load |
| Product-integrated COO | Portfolio management, launch readiness, ops enablement | Businesses with heavy engineering and roadmap dependencies | Drifting from sequencing into feature ownership |
A COO’s archetype often changes as the company moves from Series B to IPO. Early on, the role may center on GTM process control and ramp capacity. Later, it often shifts toward portfolio management, governance, cross-system data trust, and capital efficiency.
First 90 days: stabilize operations without breaking flow
The first 90 days should stabilize the business, not shock it. A new COO should resist the urge to redraw the org chart or launch a long list of transformation programs before they understand where work is actually breaking.
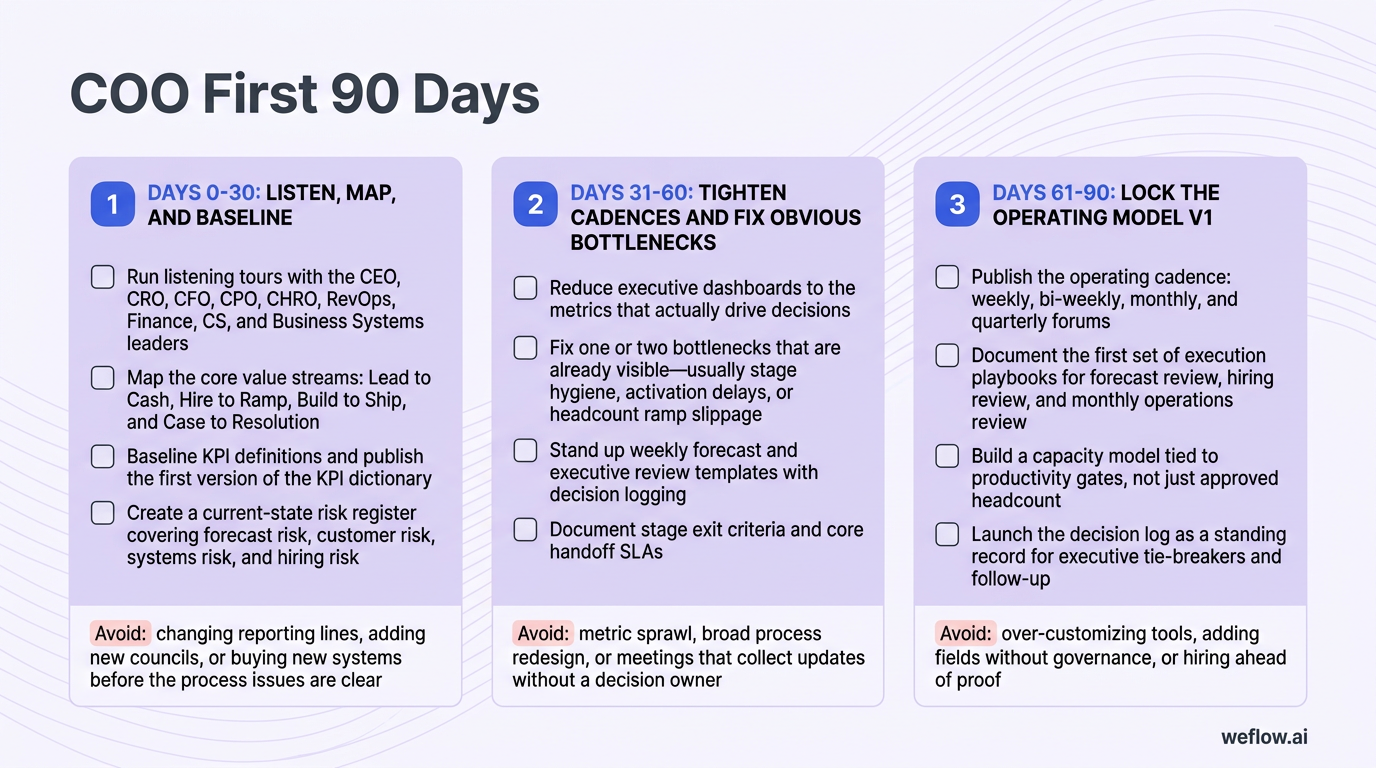
-
Days 0-30: listen, map, and baseline
- Run listening tours with the CEO, CRO, CFO, CPO, CHRO, RevOps, Finance, CS, and Business Systems leaders.
- Map the core value streams: Lead to Cash, Hire to Ramp, Build to Ship, and Case to Resolution.
- Baseline KPI definitions and publish the first version of the KPI dictionary.
- Create a current-state risk register covering forecast risk, customer risk, systems risk, and hiring risk.
- Avoid: changing reporting lines, adding new councils, or buying new systems before the process issues are clear.
-
Days 31-60: tighten cadences and fix obvious bottlenecks
- Reduce executive dashboards to the metrics that actually drive decisions.
- Fix one or two bottlenecks that are already visible—usually stage hygiene, activation delays, or headcount ramp slippage.
- Stand up weekly forecast and executive review templates with decision logging.
- Document stage exit criteria and core handoff SLAs.
- Avoid: metric sprawl, broad process redesign, or meetings that collect updates without a decision owner.
-
Days 61-90: lock the operating model v1
- Publish the operating cadence: weekly, bi-weekly, monthly, and quarterly forums.
- Document the first set of execution playbooks for forecast review, hiring review, and monthly operations review.
- Build a capacity model tied to productivity gates, not just approved headcount.
- Launch the decision log as a standing record for executive tie-breakers and follow-up.
- Avoid: over-customizing tools, adding fields without governance, or hiring ahead of proof.
Operating cadences: turn strategy into predictable execution
Operating cadence is the mechanism that converts strategy into repeatable decisions. When it works, every leader knows what gets reviewed when, which metrics matter, who makes the call, and what happens if the plan moves off track.
Value streams matter here because they cut across the org chart. Instead of asking whether Sales, Product, or CS is at fault, you inspect the flow of work from one point to the next and fix the handoff that is slowing the system down.
| Value stream | Goal | Primary KPIs | First fixes |
|---|---|---|---|
| Lead to Cash | Predictable revenue creation | Pipeline coverage, conversion rate, cycle time, win rate | Tighter stage exits, cleaner opportunity data, SLA-backed handoffs |
| Build to Ship | On-time launches with clear readiness gates | On-time delivery, post-launch defects, rollover count | WIP limits, launch gates, dependency tracking |
| Hire to Ramp | Productive capacity when the plan needs it | Time-to-fill, ramp on-time percent, attainment by cohort | Role scorecards, enablement milestones, manager capacity checks |
| Case to Resolution | Low-friction support with healthy cost-to-serve | MTTR, CSAT, reopen rate, backlog age | Triage rules, self-serve coverage, escalation paths |
Build an integrated top-down and bottom-up plan
The annual plan should combine ambition with capacity. Top-down targets from the CEO and CFO set direction, but the bottom-up model is where operating truth usually shows up.
- Start with targets. Set revenue, margin, and growth targets from the board plan and finance model.
- Model GTM capacity. Use AE quota, win rate, ASP, cycle time, manager span, SDR productivity, and CSM book load to calculate actual production capacity.
- Apply unit economic guardrails. Test the plan against CAC payback, gross margin, and Net Magic Number so hiring stays tied to efficiency.
- Sequence product and launch constraints. Map the roadmap against enablement, implementation, and customer readiness so launch dates reflect real operational capacity.
Bottom-up models often expose unrealistic top-down growth targets because they force the company to face the math: not just how much ARR it wants, but how many qualified opportunities, reps, managers, activations, and support hours are required to get there.
Define scenario triggers for market shifts
Scenario planning only works if the triggers are agreed before performance drops. If the board, CEO, and executive team wait until the quarter is already off track, every action feels reactive and political.
| Scenario | Trigger | Immediate actions | Re-entry criteria |
|---|---|---|---|
| Bull | Pipeline coverage above 4x, NRR trending up, stable win rates | Pull forward approved hires, increase capacity in high-yield segments, raise marketing volume within CAC payback guardrails | Two or more quarters of sustained outperformance |
| Base | Coverage, retention, and margin on plan | Hold hiring pace, maintain spend mix, inspect execution variance weekly | Not applicable |
| Bear | Coverage below 2.5x, NRR down, cycle time expanding, forecast variance rising | Freeze adds, reallocate spend to highest-conversion plays, tighten discount approvals, protect gross margin | Two stable quarters with coverage, retention, and forecast back in range |
Establish clear decision rights and tie-breakers
Consensus is useful until it slows down the company. The COO should document where collaboration ends and who makes the final call.
| Decision area | Final maker | Tie-breaker rule |
|---|---|---|
| Forecast commit | CRO | If the COO and CRO still disagree by more than 5% after inspection, escalate to the CEO with risk notes attached. |
| Pricing guardrails | COO through pricing council | Default to the last approved margin and discount guardrail until new data justifies a change. |
| Territory design | COO | Favor customer coverage balance and ramp realism over equal account counts. |
| Hiring plan changes | CFO | Headcount stays frozen unless productivity gates and cash assumptions are met. |
| Roadmap sequencing | CPO or CTO | When tradeoffs are equal, prioritize the sequence with the stronger NRR impact and lower launch risk. |
A pricing council is a good example of a clean tie-breaker structure. Sales may want flexibility to win a strategic deal, Finance may want tighter margins, and the COO’s job is to bring data—win rate by discount band, price realization, approval cycle time, and expansion outcomes—so the decision follows operating evidence instead of opinion.
Run weekly and monthly operational meetings
The cadence itself should be boring. What matters is the quality of inputs, the speed of decisions, and whether actions close the loop in the next meeting.
- Weekly executive meeting: Review the KPI scorecard, top risks, open decisions, and blocked cross-functional work. Output: a documented decision log with owners and dates.
- Weekly forecast call: Review pipeline by stage, commit movement, slippage, and inspection notes. Output: an updated forecast roll-up and risk list.
- Bi-weekly product council: Review roadmap dependencies, launch readiness, support impact, and capacity constraints. Output: go or no-go calls and updated delivery dependencies.
- Bi-weekly hiring and ramp review: Review open roles, ramp milestones, manager spans, and cohort productivity. Output: req approvals, ramp risk actions, and enablement changes.
- Monthly operations review: Review plan versus actual, variance, root cause, and keep-kill-scale decisions. Output: operating changes, not status updates.
- Monthly pricing review: Review margin leakage, discount exceptions, and price realization by segment. Output: revised guardrails where needed.
- Monthly risk review: Review incidents, audit issues, vendor concentration, and mitigation status. Output: updated owners and due dates on the risk register.
- Quarterly business review: Review cohort performance, customer churn patterns, launch outcomes, and next-quarter bets. Output: plan adjustments and operating priorities.
The monthly operations review fails when it turns into status theater. Keep it strict: every topic must show target, actual, variance, root cause, decision needed, and owner. If a slide can’t answer those six items, it doesn’t belong in the meeting.
Cross-functional alignment: eliminate overlap and friction
Most operating friction doesn’t come from bad intent. It comes from unclear interfaces between executives and teams that use different definitions, different planning assumptions, and different time horizons.
This is why RevOps and Data or Analytics need one semantic layer. If the CRO’s forecast dashboard and the CFO’s board deck calculate pipeline, ARR, or churn differently, the executive team spends its time debating numbers instead of decisions.
- COO and CRO: Overlap risk is sales execution ownership. Guardrail: the COO owns the revenue system, stage rules, and forecast challenge process; the CRO owns quota, rep coaching, and commit delivery.
- COO and CFO: Overlap risk is duplicate planning ownership. Guardrail: the COO orchestrates the operating plan and variance process; the CFO owns accounting policy, capital structure, and formal financial controls.
- COO and CPO: Overlap risk is roadmap ownership. Guardrail: the COO owns sequencing, launch readiness, and capacity tradeoffs; the CPO owns feature content and product direction.
- COO and CHRO: Overlap risk is people policy versus operating needs. Guardrail: CHRO owns policy and compensation philosophy; the COO owns ramp expectations, manager bar, and capacity planning inputs.
Set guardrails with the CRO, CFO, and CPO
- System vs. quota: The COO owns the system that shapes forecast quality. The CRO owns the number, the field behavior, and the inspection discipline that gets the number home.
- Plan orchestration vs. financial policy: The COO runs the planning rhythm and the reforecast process. The CFO decides the financial rules the plan has to respect.
- Sequencing vs. roadmap content: The COO decides when the business can absorb a launch. The CPO decides what gets built.
A strong COO-CRO partnership speeds deal velocity because the system gets tighter without confusing the field. Reps get clearer stage rules, cleaner approvals, better capacity coverage, and faster cross-functional decisions—without wondering who actually owns the number.
Design reporting structures for revenue flow
Operational teams should report in a way that preserves neutrality and keeps data definitions consistent across the company.
| Function | Dotted-line leader and core charter |
|---|---|
| RevOps | Dotted to the CRO for field alignment; charter is pipeline governance, forecasting logic, pricing guardrails, and KPI integrity. |
| CS Ops | Dotted to the CS leader; charter is health scoring, renewal workflows, expansion process, and adoption reporting. |
| PMO or portfolio management | Dotted to the CPO or CTO; charter is intake, prioritization, WIP limits, dependency tracking, and rollout retrospectives. |
| Business Systems | Dotted to the CIO or CTO; charter is Salesforce administration, CPQ governance, automation control, and change management. |
| Data and Analytics | Dotted to the CFO or CTO; charter is semantic layer governance, executive scorecards, cohort analysis, and master data health. |
RevOps usually works better under the COO than under the CRO when forecast trust is a company-wide issue. Reporting to the COO gives RevOps neutrality in pipeline inspection, forecast challenge, and metric governance while still keeping close working ties to the field.
Calculate management spans and GTM capacity
Capacity planning breaks when the company counts heads instead of productive capacity. Manager coverage is part of that math.
| Team | Target span | Max before risk rises | Why it matters |
|---|---|---|---|
| AE management | 1:6 to 1:8 | 1:10 | Higher spans reduce inspection quality, coaching time, and forecast accuracy. |
| SDR management | 1:8 to 1:10 | 1:12 | Quality slips first in meeting qualification and outbound consistency. |
| CSM management | 1:8 to 1:10 | 1:12 | High spans weaken renewal control and executive escalation handling. |
| Implementation leads | 1:6 to 1:8 | 1:9 | Project complexity raises the need for active oversight. |
| Support leads | 1:8 to 1:12 | 1:14 | Coverage models and incident load affect queue health and MTTR. |
Once AE manager spans move past 1:8 for any length of time, the damage usually shows up in two places: regretted attrition and forecast misses. Reps get less coaching, inspection gets shallow, new hires ramp slower, and weak pipeline behavior goes uncorrected until it hits the commit.
For AE capacity, the basic inputs are quota, win rate, ASP, sales cycle length, and required pipeline coverage. For example, if a segment needs 3.5x coverage to hit quota and ramp is slipping by 30 days, the next quarter’s pipeline gap is already forming even if current headcount looks on plan.
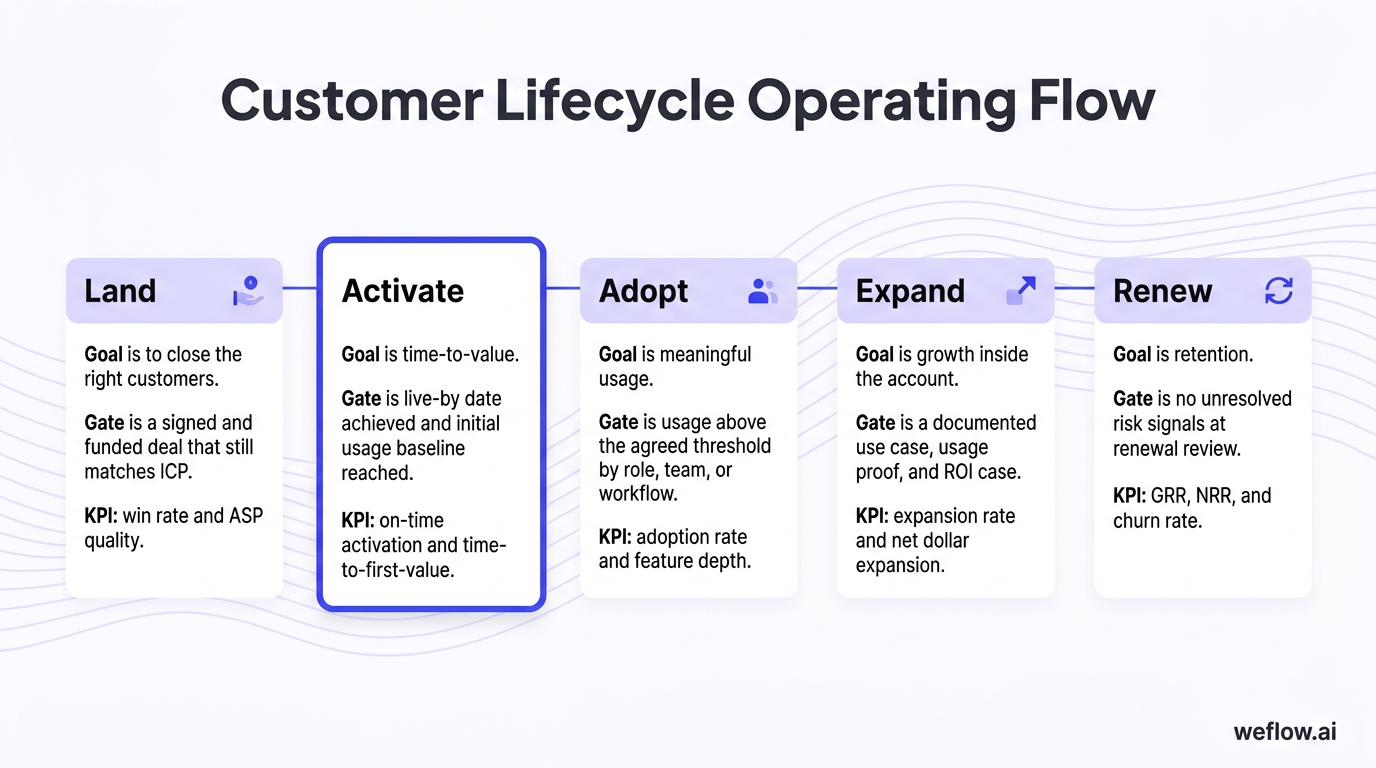
Customer lifecycle operations: protect NRR and reduce churn
Retention isn’t a CS-only issue. It’s an operating system issue. The COO should treat the post-sale journey as a managed flow with objective gates, not a soft process that relies on heroics from Sales, CS, and product teams.
The most important handoff is Activate. If time-to-first-value slips, adoption slows, expansion gets delayed, and churn risk rises long before the renewal date appears in the forecast.
- Land: Goal is to close the right customers. Gate is a signed and funded deal that still matches ICP. KPI: win rate and ASP quality.
- Activate: Goal is time-to-value. Gate is live-by date achieved and initial usage baseline reached. KPI: on-time activation and time-to-first-value.
- Adopt: Goal is meaningful usage. Gate is usage above the agreed threshold by role, team, or workflow. KPI: adoption rate and feature depth.
- Expand: Goal is growth inside the account. Gate is a documented use case, usage proof, and ROI case. KPI: expansion rate and net dollar expansion.
- Renew: Goal is retention. Gate is no unresolved risk signals at renewal review. KPI: GRR, NRR, and churn rate.
Define exit criteria for every lifecycle stage
Lifecycle stages only work if accounts can’t progress in Salesforce without meeting the gate. Fuzzy handoffs create clean-looking dashboards and weak customer outcomes.
- Land to Activate: Signed order form, funded account, ICP match confirmed, implementation owner assigned, target live date recorded, and required Salesforce fields complete.
- Activate to Adopt: Provisioning complete, kickoff done, first admin or end-user milestone reached, and usage baseline met by the target date.
- Adopt to Expand: Sustained usage above threshold, clear stakeholder map, quantified value proof, and open whitespace documented.
- Expand to Renew: Expansion case tied to ROI, decision process identified, commercial path reviewed, and no unresolved product or support blockers.
- Renewal ready: Health score in range, executive sponsor identified for at-risk accounts, and legal or procurement risk surfaced before the final negotiation window.
Fuzzy Sales-to-CS handoffs often inflate churn 12 months later. The company books the ARR, but the customer starts with missing context, a weak champion, or the wrong success criteria—and those problems compound quietly until renewal.
Categorize churn to deploy targeted playbooks
Not all churn should be managed the same way. If the company mixes payment failures, failed onboarding, and customer M&A into one bucket, it learns nothing.
- Involuntary churn: Revenue lost because of payment failure or technical issue. Playbook: dunning, billing remediation, provisioning fixes, and root-cause review with Finance and support.
- Voluntary avoidable churn: Revenue lost because the customer didn’t see enough value, adoption stalled, or the relationship weakened. Playbook: success plan, executive sponsor coverage, adoption intervention, and risk inspection well before renewal.
- Voluntary unavoidable churn: Revenue lost because of events like customer shutdown, M&A, or strategic business closure. Playbook: early warning, exposure tracking, and loss containment.
COOs should remove unavoidable churn from CS performance metrics when judging team effectiveness. That gives a cleaner read on whether the team is failing to retain value-driven accounts or simply absorbing macro and corporate events they can’t control.
Data governance: build a single source of truth for growth
Data trust is an operating issue, not a reporting issue. If the company doesn’t trust the numbers, every forecast call gets longer, every board deck becomes manual, and every hiring decision becomes slower than it should be.
An over-customized CRM is one of the fastest ways to damage that trust. In Salesforce, that usually means duplicate fields, conflicting validation rules, unmanaged custom objects, one-off automations, and reporting logic that lives in spreadsheets instead of in the system of record. The cost shows up in slower decisions, more admin work, and weaker CAC payback because operators spend time fixing data instead of improving the revenue engine.
- Core stack: Salesforce as the opportunity engine, CPQ and billing for commercial accuracy, ERP for financial truth, product analytics for usage signals, and a data warehouse for the KPI layer.
- Governance routines: A versioned KPI dictionary, master IDs, weekly data quality checks, semantic layer governance, and clear ownership for every board-level metric.
Standardize the core revenue technology stack
Before the company buys more point tools, it should lock the core data model and integration paths for the systems already running the business.
| Domain | System | Key integrations |
|---|---|---|
| CRM | Salesforce | CPQ, billing, marketing automation, CS platform, support system |
| CPQ and billing | CPQ and billing platform | Salesforce opportunities, ERP, revenue recognition workflows |
| ERP | Finance system | Billing, collections, procurement, accounting close |
| Product analytics | Usage analytics platform | Data warehouse, CS health scoring, expansion signals |
| Data warehouse | Snowflake, BigQuery, or similar | Salesforce, CPQ, ERP, product analytics, support data |
If Salesforce opportunity definitions, account IDs, and commercial objects aren’t stable yet, adding more tools usually multiplies data cleanup work. The right order is simple: lock the CRM model, lock the warehouse grain, then decide what extra systems are still needed.
Track efficiency and predictability metrics
Board-level metrics should stay narrow. They exist to tell the executive team whether the business can keep investing, needs to hold pace, or should pull back.
- Net Revenue Retention (NRR): Shows whether existing revenue is compounding after churn and expansion.
- Gross Margin %: Shows whether growth produces usable gross profit or hides delivery and pricing problems.
- CAC Payback: Shows how long it takes to recover sales and marketing spend on a gross-margin-adjusted basis.
- Net Magic Number: Shows how efficiently prior-quarter sales and marketing spend turned into net new ARR.
- Rule of 40: Shows whether the balance of growth and profitability is healthy enough for the current stage.
- Opex % of Revenue: Shows whether operating cost is staying in line as revenue grows.
Net Magic Number is often the fastest way to frame the headcount decision. If efficiency is improving and the pipeline model supports it, the COO has a case to accelerate hiring. If it’s falling, hiring should pause until conversion, pricing, or retention improves.
Monitor capacity and sales productivity signals
Weekly ops reviews need leading indicators, not just lagging board metrics.
- Pipeline coverage: The ratio of qualified pipeline to target bookings. It tells you whether the quarter has enough fuel before the forecast misses.
- Pipeline velocity: The speed at which qualified opportunities move toward close. It shows where stage drag is building.
- Ramp time actuals: The actual time new hires need to reach productivity versus the modeled ramp. It shows whether headcount will land when the plan expects it.
- Ramp on-time %: The share of hires hitting ramp milestones by the expected month. It predicts future pipeline gaps better than raw headcount does.
- On-time activation: The share of closed-won customers that go live by the promised date. It connects bookings quality to NRR risk.
- ARR per FTE: Revenue productivity by total headcount or by function. It shows whether complexity is diluting output.
- Price realization %: Revenue captured versus target price after discounts and terms. It exposes margin leakage.
Ramp On-Time % matters because a slow enablement month usually ruins the next quarter’s forecast before anyone says it out loud. The company sees the hiring count, assumes capacity is coming, and misses the fact that delayed productivity means pipeline creation and deal progression will land late.
FAQ
What is the difference between a COO and a CRO?
The CRO owns quota, rep management, forecast commits, and day-to-day revenue delivery. The COO owns the operating system around that work: planning cadence, capacity models, cross-functional handoffs, decision rules, and the guardrails that keep the number believable.
How should a COO measure CAC payback?
Use gross-margin-adjusted sales and marketing cost divided by net new ARR per month. The key is consistency: keep the same cost scope, gross margin treatment, and booking definition every quarter so hiring decisions aren’t made on changing math.
What metrics belong in a weekly executive review?
Keep it tight: pipeline coverage, forecast variance, major SLA breaches, activation risk, hiring and ramp variance, and critical items from the risk register. If a metric doesn’t change an executive decision that week, it should move to a monthly or quarterly review instead.
How does a COO manage product roadmap dependencies?
The COO shouldn’t decide features. The role is to manage readiness gates, GTM timing, support impact, launch dependencies, and whether the company has the capacity to absorb the release without hurting forecast quality or customer experience.
How often should a COO reforecast?
Most B2B SaaS companies should run a weekly forecast inspection and a monthly reforecast with Finance. Weekly reviews catch pipeline movement early; monthly reforecasts update the operating plan, hiring assumptions, and spend controls before small misses compound.
Where should RevOps report in a B2B organization?
If the main problem is field execution inside one sales org, RevOps can sit with the CRO. If the main problem is forecast trust, cross-functional planning, and metric governance, RevOps usually works better under the COO with a strong dotted line to the CRO.
.webp)

.webp)
.webp)

.webp)
.webp)
.webp)
.webp)

.webp)