

RevOps Metrics and Benchmarks to Track Growth, Efficiency, and Retention
RevOps leaders don’t need more dashboards. They need a short list of metrics that show whether growth is efficient, forecastable, and durable.
This guide turns a benchmark cheat sheet into a working reference for revenue teams that run on Salesforce. It covers the investor, financial, marketing, sales, and customer success metrics that matter most—and what “good” looks like by stage and segment.
One note before you start: benchmarks only help if the underlying Salesforce data is complete. If activity sync, field mapping, or Salesforce write-back are inconsistent, the metric looks precise while the operating decision is wrong.
[banner type="download" url="https://www.weflow.ai/content/revops-metrics-cheat-sheet" text="RevOps Metrics & Benchmarks Cheat Sheet" subtitle="Benchmark tables, formulas, and definitions for investor, sales, and efficiency metrics." button="Download now"]Investor metrics: benchmark valuation and capital efficiency
Boards and investors use a small set of efficiency and profitability metrics to judge whether a SaaS company is growing on solid economics or buying revenue with weak payback. RevOps usually doesn’t own every input, but it often owns the Salesforce data model, attribution logic, and reporting process behind them.
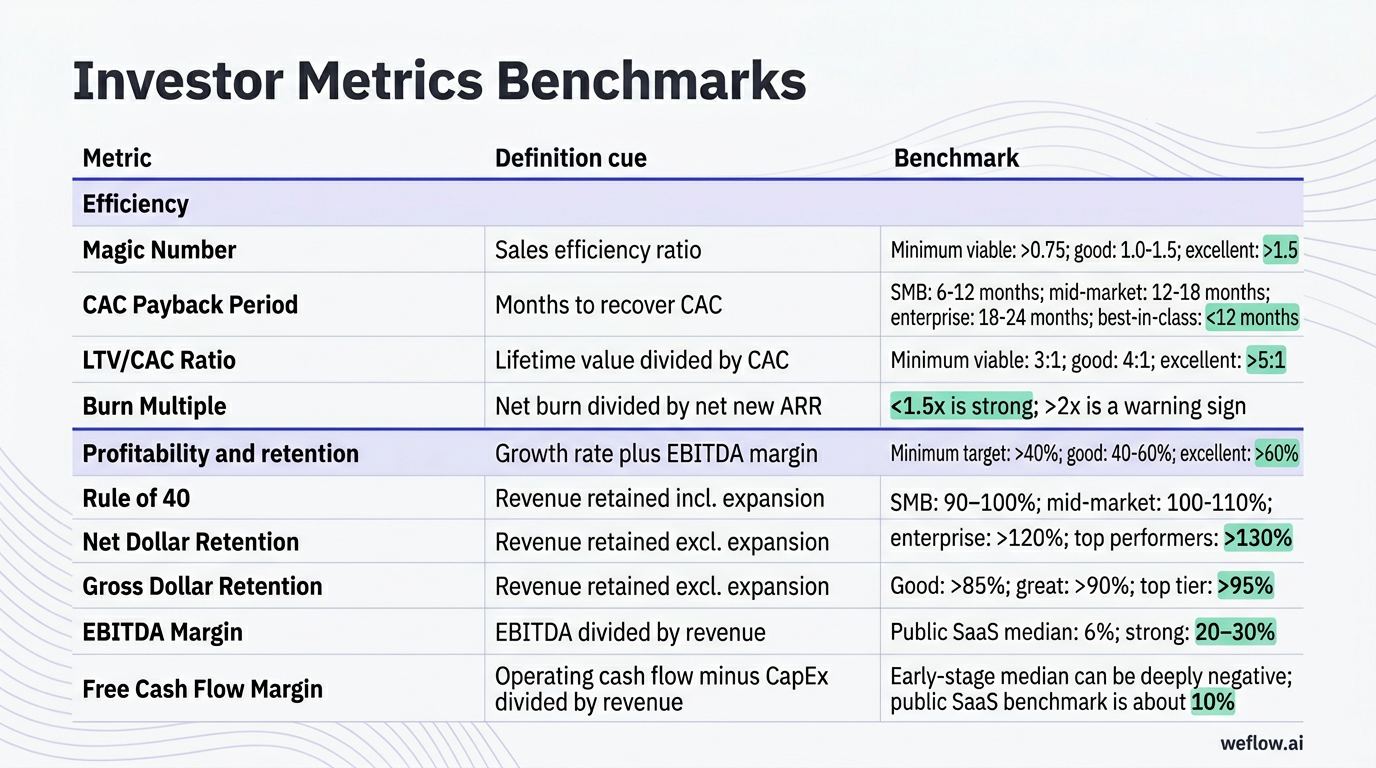
| Metric | Definition | Benchmark |
|---|---|---|
| Efficiency | ||
| Magic Number | Sales efficiency ratio: net new ARR divided by the previous quarter’s sales and marketing spend. | Minimum viable: >0.75; good: 1.0-1.5; excellent: >1.5 |
| CAC Payback Period | Months needed to recover customer acquisition cost from gross margin-adjusted account revenue. | SMB: 6-12 months; mid-market: 12-18 months; enterprise: 18-24 months; best-in-class: <12 months |
| LTV/CAC Ratio | Customer lifetime value divided by customer acquisition cost. | Minimum viable: 3:1; good: 4:1; excellent: >5:1 |
| Burn Multiple | Net burn divided by net new ARR. Shows how much cash the company spends to add new recurring revenue. | <1.5x is strong; >2x is a warning sign |
| Profitability and retention | ||
| Rule of 40 | YoY revenue growth rate plus EBITDA margin. | Minimum target: >40%; good: 40-60%; excellent: >60% |
| Net Dollar Retention | Revenue retained from an existing customer base after expansion, contraction, and churn. | SMB: 90-100%; mid-market: 100-110%; enterprise: >120%; top performers: >130% |
| Gross Dollar Retention | Recurring revenue retained from existing customers, excluding expansion. | Good: >85%; great: >90%; top tier: >95% |
| EBITDA Margin | EBITDA divided by revenue. | Public SaaS median: 6%; strong: 20-30% |
| Free Cash Flow Margin | Operating cash flow minus CapEx, divided by revenue. | Early-stage median can be deeply negative; public SaaS benchmark is about 10% |
The balance between growth and profitability shifts as companies mature. Early-stage companies can tolerate lower margins if revenue growth is strong, while later-stage companies are expected to show cleaner payback, stronger retention, and better cash generation—not just top-line momentum.
Calculate core profitability and efficiency ratios
If you want a quick view of whether the business model works, start with these formulas.
- Magic Number = Net New ARR / previous quarter sales and marketing spend. A result above 0.75 suggests the go-to-market motion is at least economically viable. If it drops below 0.75, the right move is usually to slow spend, audit funnel conversion by segment, and fix sales efficiency before adding headcount.
- LTV/CAC Ratio = Customer Lifetime Value / Customer Acquisition Cost. A 3:1 ratio is the minimum most B2B SaaS operators want to see. Below that, acquisition cost is eating too much future value. At 4:1, the business is in healthier shape. Above 5:1, the economics are strong—but if growth is slowing, you may also be underinvesting.
- EBITDA Margin = EBITDA / Revenue × 100. This shows operating profitability before financing and accounting adjustments. Public SaaS medians sit near 6%, while 20-30% signals strong operating discipline.
- FCF Margin = (Operating Cash Flow - CapEx) / Revenue × 100. Free cash flow matters because it shows whether reported growth turns into usable cash. Early-stage companies can run negative for a long time, but that only works if retention and payback are improving at the same time.
Measure revenue retention and cash flow margins
Retention metrics tell you whether the company keeps the revenue it fought to acquire. Cash flow margins tell you whether that retained revenue improves operating flexibility or just offsets more burn.
| Metric | How to read it |
|---|---|
| Net Dollar Retention (NDR) | Includes expansion, contraction, and churn. This is the clearest board-level signal that existing accounts are growing. Best-in-class companies aim for more than 130% because expansion revenue compounds without full new-logo CAC. |
| Gross Dollar Retention (GDR) | Excludes expansion and caps at 100%. Use it to isolate baseline product and service retention quality. High NDR with weak GDR can mean expansion is masking underlying leakage. |
| CAC Payback by segment | Shorter payback is common in SMB because acquisition cost is lower and ramp is faster. Mid-market usually lands in the 12-18 month range. Enterprise can stretch to 18-24 months if ACV, retention, and expansion support it. |
| Free cash flow margin | Use this to test whether retention quality is showing up in cash generation. Strong NDR with poor cash conversion usually points to a spending problem, a billing problem, or both. |
Financial metrics: monitor revenue growth and cash runway
Investor metrics tell you how the company looks from the outside. Financial operating metrics tell you how much time and room the company has to execute from the inside.
| Growth metric | Definition | Benchmark |
|---|---|---|
| ARR | Normalized annual value of active recurring subscriptions, excluding one-time and services revenue. | Seed: $0.2M-$1M; Series A: $1M-$3M; Series B: $5M-$20M; growth stage: $20M+ |
| MRR | Predictable monthly recurring subscription revenue. ARR divided by 12. | Early-stage target: 10-15% monthly growth; growth stage: 5-7% |
| YoY growth rate | Percentage change in revenue or another metric versus the same period last year. | Early-stage: 3x, 3x, 2x, 2x pattern; growth stage: 40-100%; scale: 20-40% |
| QoQ growth rate | Percentage change versus the previous quarter. | Early-stage: 15-25%; growth stage: 10-15%; scale: 5-10% |
| Logo growth rate | Net increase in paying customers over a period. | Early-stage: >10% monthly; growth: 3-5% monthly; enterprise: 1-2% monthly |
| Financial health metric | Definition | Benchmark |
|---|---|---|
| Burn rate | Monthly net cash outflow. Often calculated as operating expenses minus revenue. | Should not exceed 1/12 of the last funding round; burn multiple should stay below 1.5 |
| Runway | Cash balance divided by monthly burn rate. | Minimum: 12 months; ideal: 18-24 months; uncertain markets: 24-36 months |
| Cash Conversion Cycle | Time between spending to acquire customers and collecting cash from them. | Annual upfront contracts: negative CCC; monthly contracts: 30-60 days; enterprise billing: 60-90 days |
| Gross margin | Revenue left after direct cost of delivery. | Infrastructure SaaS: 65-75%; pure SaaS: 80-85%; top tier: >85% |
| Operating Expenses Ratio | Total operating expenses divided by revenue. | Early-stage: 150-200%; growth: 100-150%; scale: 60-80%; mature: 40-60% |
The Cash Conversion Cycle matters more than many teams realize. If customers pay annual contracts upfront, cash arrives before the full delivery cost is incurred, which can create a negative cash conversion cycle and improve runway. If billing is monthly or collections lag, growth can look healthy on paper while cash tightens.
Track recurring revenue and period-over-period growth
ARR and MRR benchmarks only make sense in the context of company maturity. The same revenue number means different things at Seed, Series B, and scale.
- Seed stage: ARR often lands between $0.2M and $1M, with MRR expected to grow 10-15% month over month. YoY expectations are still steep because the revenue base is small.
- Series A: ARR usually moves into the $1M-$3M range. Teams still need strong QoQ growth, but repeatability starts to matter as much as raw pace.
- Series B: ARR often sits between $5M and $20M. Growth should still be healthy, but investors start asking whether the business can hold efficiency while adding headcount.
- Growth stage: ARR above $20M shifts the conversation toward predictability, retention, and margin. MRR growth slows to 5-7% monthly, but expansion revenue and larger ACVs can still keep ARR growing at an attractive rate.
- Scale stage: YoY growth often settles in the 20-40% range. That doesn’t automatically mean the engine is weakening—percentage logo growth naturally slows as the customer base gets larger and average contract value carries more of the load.
Assess cash burn, runway, and operating expenses
These are the finance checks RevOps leaders should review monthly with the CFO or FP&A team, especially if hiring plans depend on clean pipeline and forecast data.
- Net burn: Calculate monthly cash outflow after revenue. If burn rises faster than net new ARR, sales efficiency is getting worse even if bookings look healthy.
- Runway: Twelve months is the floor. In tighter markets, 24-36 months is often the safer operating target because fundraising timelines and buyer scrutiny both stretch.
- Gross margin: SaaS businesses with margins below category norms need a clear reason—high implementation cost, infrastructure-heavy delivery, or services mix.
- Operating Expenses Ratio: Track how much of revenue goes to payroll, sales, marketing, G&A, and product. The ratio should decline as revenue scales.
- Burn multiple: Use it as the fastest read on whether cash burn is buying enough ARR growth to justify the spend.
Marketing metrics: optimize acquisition costs and lead flow
Marketing benchmarks matter when they help RevOps spot bottlenecks before spend increases. The question isn’t whether lead volume is up. The question is whether the leads turn into qualified pipeline at a cost the business can support.
- Traffic: Track unique visitors, source mix, time on site, and bounce rate to see whether demand creation is producing qualified attention or low-intent clicks.
- Conversion: Watch visitor-to-lead conversion, MQL-to-SQL conversion, lead scoring quality, and MQL response time. If response time is slow, more spend usually creates more waste.
- Cost: Monitor CPC, cost per MQL, and CPA by segment. These numbers tell you how much budget pressure each growth motion adds.
MQL response time is often the first operational bottleneck to fix. If inbound leads wait more than an hour for follow-up, conversion drops before Sales even enters the picture, and the marketing team can’t spend its way around that gap.
Evaluate website traffic and conversion performance
Early-stage teams should care more about traffic growth rate than raw traffic volume. A site with 8,000 monthly visitors growing 20% quarter over quarter is often in better shape than a flat site with 50,000 visitors and weak conversion.
Top-performer benchmark: Visitor-to-lead conversion above 5% is a strong sign that messaging, offer, and targeting are working together.
Top-performer benchmark: Organic search making up 40-50% of traffic, with direct traffic at 15-25%, usually indicates a healthier inbound mix than paid-heavy acquisition alone.
Top-performer benchmark: Time on site above four minutes and bounce rate below 40% suggest visitors are finding relevant content and taking the next step.
For RevOps, the operational question is simple: can you tie this traffic to opportunity creation in Salesforce without attribution gaps? If campaign source, lead source, and lifecycle stage logic are inconsistent, website benchmarks won’t translate into budget decisions.
Analyze MQL quality, response times, and unit costs
Lead quality sits between marketing efficiency and sales productivity. If the scoring model is weak, MQL volume rises while SQL conversion falls—and CAC gets worse even when top-of-funnel numbers look good.
| Segment | Typical cost profile | What to watch |
|---|---|---|
| SMB | CPA: $100-$500; lower-cost channels often dominate | Fast lead response, tight qualification, and low-friction conversion matter more than deep account research |
| Mid-market | CPA: $500-$2,000; cost per MQL often sits in the $30-$100 range | Lead scoring quality starts to matter more because poor-fit leads waste SDR time fast |
| Enterprise | CPA: $2,000-$10,000+; paid acquisition and event spend can skew higher | Volume matters less than account fit, speed-to-meeting, and conversion to qualified pipeline |
A good lead scoring model should push at least 60% of MQLs into SAL status. If that handoff rate is lower, revisit the scoring inputs: firmographic fit, intent signals, buying committee role, and engagement thresholds. Then check response time. Even a well-scored MQL loses value when routing or SDR follow-up lags.
As a rule of thumb, B2B SaaS teams want MQL-to-SQL conversion in the 15-30% range, and first-touch response in under one hour. If you miss both, fix routing, ownership, and SLA enforcement before raising budget.
Sales metrics: accelerate pipeline velocity and win rates
Sales metrics determine whether the forecast is grounded in deal reality or just stage-based optimism. For RevOps leaders, this is where pipeline hygiene, activity completeness, and stage compliance start to show up in the number your CRO takes to the board.
| Metric | Definition | Benchmark |
|---|---|---|
| Pipeline Coverage Ratio | Pipeline value divided by revenue target for the period. | Enterprise: 3-4x; many mid-market teams plan for 5-6x |
| Pipeline Velocity | (Number of deals × average deal size × win rate) / sales cycle length | Healthy pipelines keep stagnant deals below 20% |
| Average Deal Size | Closed-won revenue divided by number of closed-won deals. | SMB: $1K-$10K; mid-market: $10K-$100K; enterprise: $100K+ |
| Win Rate | Won deals divided by total closed deals. | B2B SaaS average: 20-30%; top teams: >35%; enterprise: 15-25% |
| Sales Cycle Length | Time from first meaningful contact to close. | SMB: 1-3 months; mid-market: 3-6 months; enterprise: 6-12+ months |
| Quote-to-close ratio | Quotes or proposals that convert into closed-won deals. | Average: 20-30%; top teams: >40% |
| Sales productivity ramp time | Time for new reps to reach expected output or quota. | SDRs: 3-4 months; AEs: 6-9 months; enterprise AEs: 9-12 months |
Pipeline coverage targets differ by segment because win rates, ACV, and cycle time differ by segment. Enterprise teams usually need at least 3-4x coverage because deals are fewer, larger, and slower. Mid-market teams often need 5-6x because deal quality varies more and qualification noise is higher.
Monitor pipeline coverage, deal size, and cycle length
Pipeline velocity is one of the clearest ways to combine volume, value, conversion, and timing into a single operating metric.
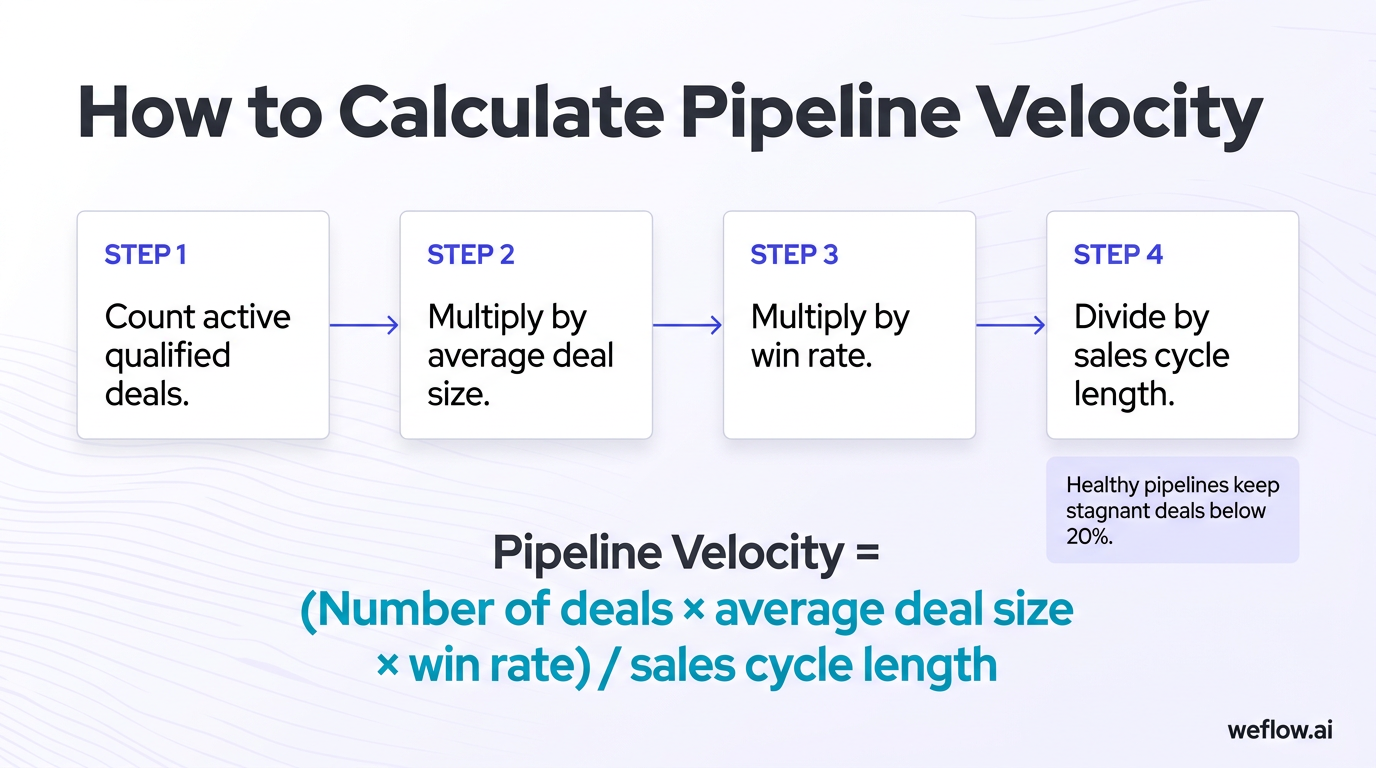
- Count active qualified deals. Only include opportunities that meet your Salesforce stage-entry criteria. Loose qualification inflates velocity before it helps forecast accuracy.
- Multiply by average deal size. This converts count into pipeline value and shows whether larger deals are offsetting lower volume.
- Multiply by win rate. This removes wishful thinking from the model and applies an observed conversion rate.
- Divide by sales cycle length. Faster cycles increase velocity because revenue converts sooner.
A healthy pipeline shouldn’t let stale deals accumulate. If more than 20% of opportunities sit without real stage progression, updated next steps, or new customer activity, the pipeline is overstated and the forecast is weaker than it looks.
Use deal size brackets as a reality check. SMB deals in the $1K-$10K range can tolerate higher volume and shorter cycles. Mid-market often lands between $10K and $100K. Enterprise starts at $100K+ and typically requires tighter qualification, stronger multi-threading, and more rigorous exit criteria between stages.
Measure rep productivity, capacity, and activity levels
Rep productivity metrics only work if activity capture is reliable in Salesforce. If meetings, emails, and calls don’t write back cleanly—or if you rely on partial activity sync through EAC or a shallow integration footprint—you’ll undercount effort and misread capacity.
SDR daily targets
- Calls: 30-50
- Emails: 50-75
- Ramp time: 3-4 months
- Primary output: meetings created and accepted pipeline
AE daily targets
- Calls: 15-20
- Emails: 20-30
- Meetings: about 2-3 per day
- Active opportunities: often 15-30, depending on segment and deal complexity
- Ramp time: 6-9 months; enterprise AEs often need 9-12 months
Sales capacity utilization is the broader benchmark to watch. Industry averages often sit in the 35-45% range for actual selling time. Top-performing teams get above 60% by reducing admin work, tightening process compliance, and making sure activity capture happens automatically instead of through rep memory.
Customer success metrics: drive adoption and net retention
Closed-won is the start of revenue quality, not the end. If adoption is weak or time-to-value drifts, those issues show up later as churn, contraction, and missed NDR targets.
| Metric | Definition | Benchmark |
|---|---|---|
| Time to First Value | Time from purchase to the customer reaching its first clear value milestone. | SMB: days to weeks; enterprise: 1-3 months |
| Product Adoption Rate | Share of purchased features or modules actively used. | Good: >60%; top tier: >80% |
| Core feature usage | Depth and frequency of use for the product’s primary workflows. | Core features used by >80% of customers; secondary features by >40% |
| NPS | Likelihood to recommend, measured as promoters minus detractors. | B2B SaaS: 30-40; top performers: >50 |
| CSAT | Satisfaction with support or service interactions. | B2B SaaS: 75-85%; top performers: >90% |
| Customer churn rate | Percentage of customers that cancel or fail to renew. | SMB: 3-5% monthly; enterprise: <1% monthly; best-in-class: <5% annually |
| Revenue churn rate | Recurring revenue lost from existing customers. | SMB: 5-7% annually; enterprise: <5% annually; negative churn is the target |
| NRR | Revenue retained from existing customers including expansion. | Good: >100%; great: >110%; top tier: >120% |
| GRR | Revenue retained from existing customers excluding expansion. | Good: >85%; great: >90%; top tier: >95% |
| Expansion revenue | Upsell, cross-sell, or usage-based growth from current customers. | Healthy SaaS mix: 20-30% of total revenue; top tier: >40% |
These metrics connect directly back to investor metrics. Strong onboarding and adoption usually improve GRR first, then NRR. Expansion revenue lifts NRR further, which improves Rule of 40 outcomes without requiring the same acquisition spend as new ARR.
Track time-to-value, feature usage, and satisfaction
- Time to First Value: SMB customers should usually see value in days or weeks. Enterprise customers often need one to three months because setup, stakeholder alignment, and process change take longer.
- Product adoption rate: A rate above 60% is healthy. Above 80% usually means onboarding, enablement, and customer fit are working well.
- Core feature usage: You want more than 80% of customers regularly using the product’s main workflow, with at least 40% engaging secondary capabilities.
- NPS: A score in the 30-40 range is solid for B2B SaaS. Above 50 shows stronger advocacy and usually correlates with lower churn risk.
- CSAT: A 75-85% range is normal. Above 90% suggests support quality is consistently strong.
Time to First Value is one of the strongest leading indicators for renewal. Customers who reach a clear outcome early are more likely to adopt core workflows, involve more users, and buy more later. Customers who stall during onboarding rarely become stable retention stories without intervention.
Calculate churn, lifetime value, and expansion revenue
Negative churn means expansion revenue from existing customers is greater than the revenue lost from churn and contraction. That is the clearest sign that the product is becoming more valuable after the initial sale.
- Customer churn vs. revenue churn: Customer churn counts logos. Revenue churn counts dollars. Losing one small customer and one strategic account both count as one customer lost, which is why revenue churn is often the more useful operating measure.
- CLV to CAC: Healthy B2B SaaS usually targets a 3x-5x ratio. Lower than 3x puts pressure on acquisition economics. Higher than 5x is strong, assuming growth hasn’t stalled.
- Expansion revenue: A healthy SaaS business often gets 20-30% of total revenue from existing-account growth. If expansion is consistently below that, the retention model may depend too heavily on new logo acquisition.
Expansion revenue matters because it’s how many SaaS companies turn good GRR into strong NRR. It also gives RevOps a cleaner story for the board: the company isn’t just acquiring customers, it’s growing account value after adoption.
Customer journey mapping: align metrics across the lifecycle
Benchmarks become useful when they map to one revenue lifecycle instead of five disconnected team dashboards. Marketing, Sales, and Customer Success each own part of the motion, but RevOps owns the handoffs, definitions, and reporting logic that keep the full path measurable in Salesforce.
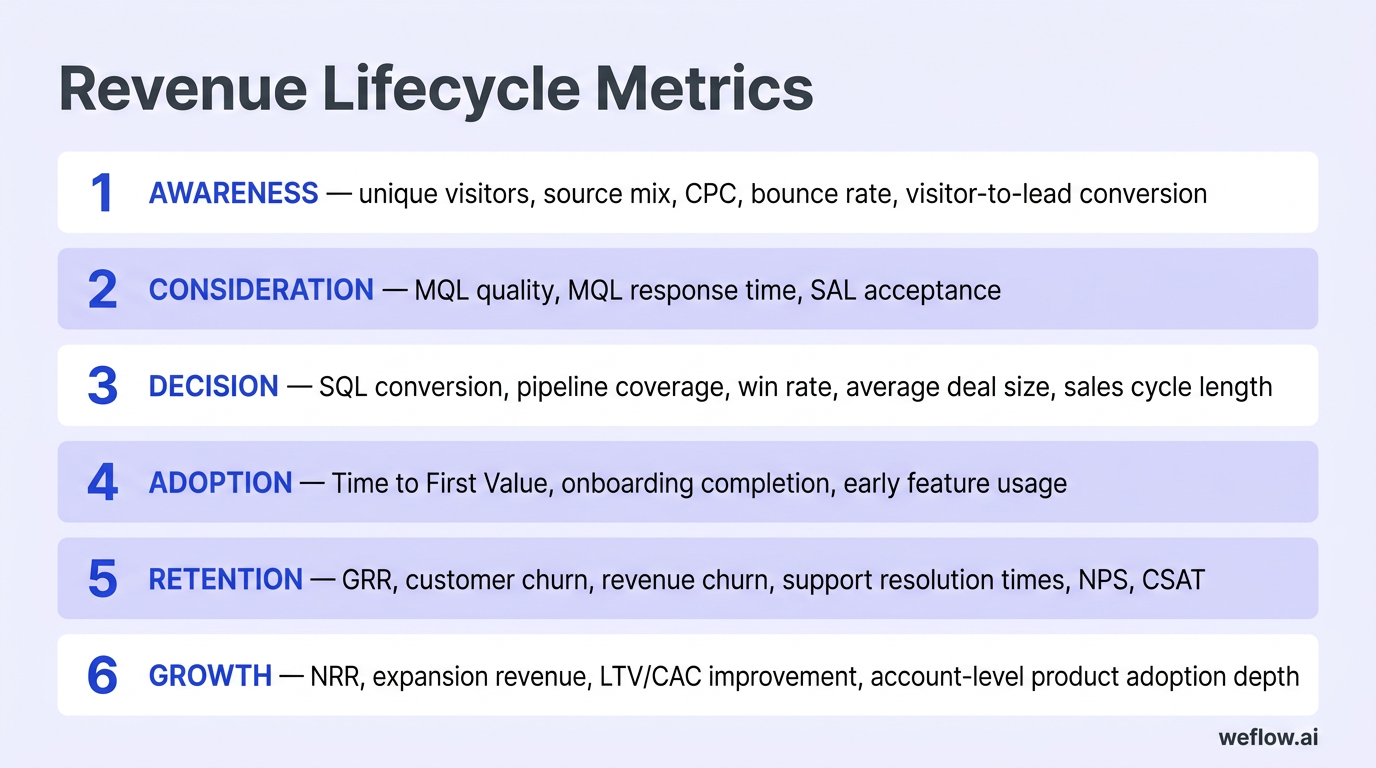
- Awareness: Track unique visitors, source mix, CPC, bounce rate, and visitor-to-lead conversion.
- Consideration: Measure MQL quality, MQL response time, and SAL acceptance to see whether early demand is sales-ready.
- Decision: Watch SQL conversion, pipeline coverage, win rate, average deal size, and sales cycle length.
- Adoption: Measure Time to First Value, onboarding completion, and early feature usage.
- Retention: Track GRR, customer churn, revenue churn, support resolution times, NPS, and CSAT.
- Growth: Measure NRR, expansion revenue, LTV/CAC improvement, and account-level product adoption depth.
The handoff points matter as much as the stage metrics. Define who owns the lead, the opportunity, the implementation milestone, and the renewal record. Then enforce those definitions in Salesforce with clear stage entry criteria, required fields, and reporting that doesn’t depend on rep memory.
This is also where a Revenue AI platform starts to matter. Weflow, a Salesforce-native revenue AI platform, helps RevOps leaders capture activity data, conversation intelligence, deal signals, and forecast inputs across the full customer journey—inside Salesforce, with less manual work and a smaller integration footprint. If you’re replacing EAC or cleaning up a Gong-heavy workflow, deeper Salesforce write-back and cleaner field mapping make benchmark tracking more trustworthy.
FAQ
What is a good Rule of 40 benchmark for SaaS?
A good Rule of 40 score is above 40%. In practice, 40-60% is strong and above 60% stands out. The mix matters: early-stage companies often get there through faster growth, while later-stage companies are expected to carry more of the score through EBITDA discipline.
How do you calculate the CAC payback period?
Use this formula: CAC / (ARPA × Gross Margin). The gross margin adjustment matters because payback should reflect contribution, not top-line billings. Best-in-class SaaS teams usually target payback in under 12 months, though enterprise motions can run longer if retention and expansion are strong.
What is the difference between NRR and GRR?
NRR, also called NDR, includes expansion revenue from upsells, cross-sells, and usage growth. GRR excludes expansion and measures only how much baseline recurring revenue you kept, which means it can never exceed 100%. Use GRR to judge retention quality, and NRR to judge account growth after the sale.
How much pipeline coverage do enterprise sales need?
Enterprise sales teams usually need 3-4x pipeline coverage against quota. Many mid-market teams plan for 5-6x because lower ACV, less stable qualification, and faster stage churn require more funnel volume to create the same forecast confidence. The right number depends on win rate and cycle length, not just quota size.
What is a healthy LTV to CAC ratio for B2B?
A 3:1 LTV to CAC ratio is the minimum viable benchmark for most B2B SaaS companies. Around 4:1 is healthy, and above 5:1 is strong. If the ratio is much lower, acquisition is too expensive. If it’s much higher, you may have room to spend more aggressively on growth.
.webp)

.webp)
.webp)

.webp)
.webp)
.webp)
.webp)

.webp)