

QBR Cheat Sheet: Run Data-Driven Quarterly Reviews That Improve Forecast Accuracy [Step-by-Step]
Bad QBRs look busy but don’t change anything. Leaders trade status updates, reps defend deals, and the forecast stays just as shaky as it was the week before.
A good QBR does the opposite. It gives RevOps, sales leadership, and customer teams one clear view of what happened, what’s at risk now, and what needs to change next quarter.
This guide walks through the structure, data, roles, and follow-through required to run QBRs that improve win rates, tighten forecast confidence, and create real accountability inside Salesforce.
[banner type="download" url="https://www.weflow.ai/content/qbr-cheat-sheet" text="QBR Cheat Sheet for RevOps Teams" subtitle="Get quarterly review frameworks, KPI checklists, and next-quarter planning prompts." button="Get it free"]QBR fundamentals: align teams and expose pipeline bottlenecks
A quarterly business review is a structured review of performance at the end of each quarter. The goal isn’t to admire historical numbers—it’s to use them to correct course, tighten execution, and enter the next quarter with a more reliable plan.
That’s the point behind the common Salesforce and HubSpot view of QBRs: ask better questions, use data to find what changed, and turn the meeting into a decision point. For RevOps teams, that means less storytelling and more evidence from pipeline, activity, conversion, retention, and forecast data inside Salesforce.
|
Pipeline visibility
Review the full funnel in one place, spot coverage gaps, and identify stalled or over-aged deals before they distort the forecast. |
Execution
See where deals slip, where stages stall, and where managers need to coach on qualification, next steps, or deal progression. |
|
Forecasting
Use current pipeline quality—not just pipeline volume—to improve commit confidence and reduce forecast error rate. |
Accountability
Assign metric ownership, force alignment across Sales and CS, and leave the room with named owners and dates. |
Define the review purpose and scope
- Evaluate past performance: Compare bookings, attainment, conversion, retention, and execution against plan.
- Align on the next quarter: Set clear revenue targets, pipeline build needs, and operating priorities.
- Check growth and efficiency: Review whether process, headcount, and systems are supporting the plan or slowing it down.
- Connect customer outcomes to revenue: Include churn risk, renewal timing, and expansion readiness where they affect forecast confidence.
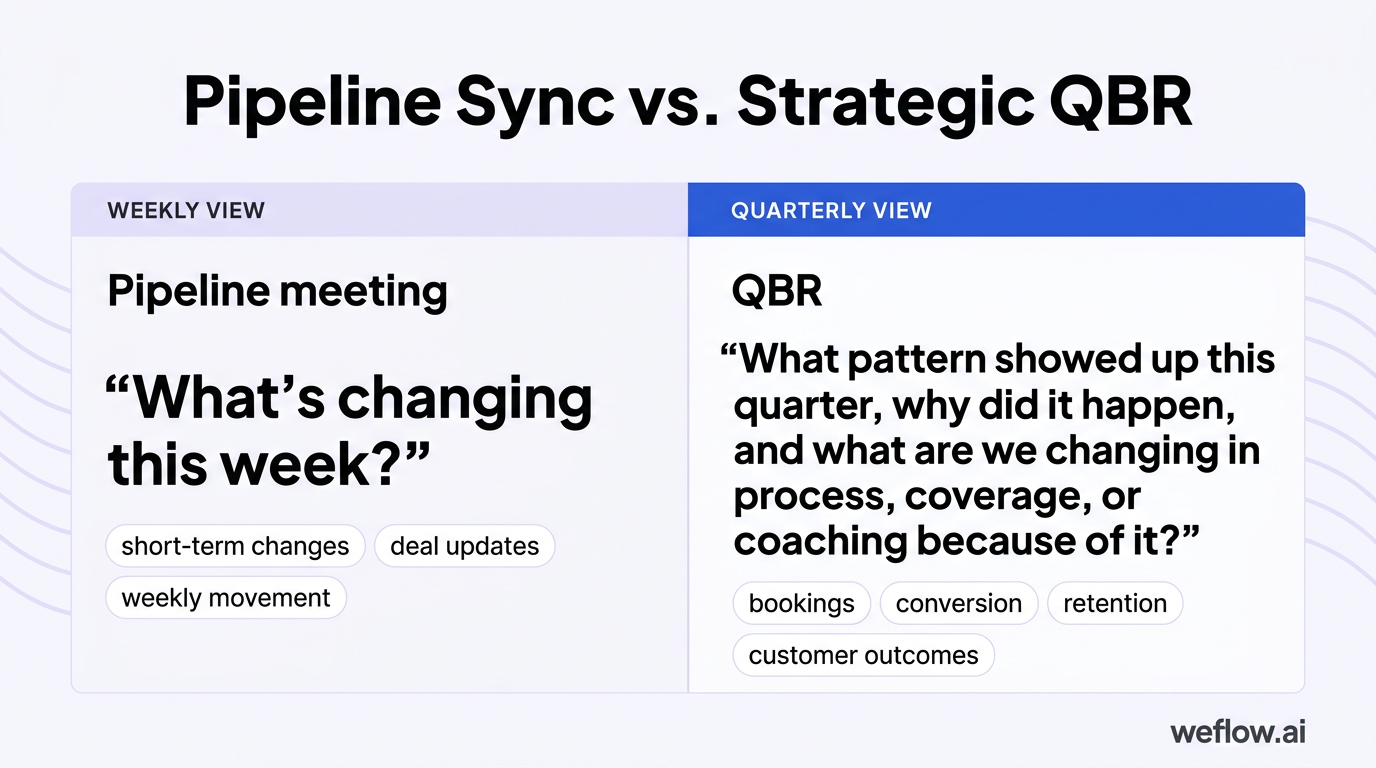
A strategic QBR is different from a weekly pipeline sync. A pipeline meeting asks, “What’s changing this week?” A QBR asks, “What pattern showed up this quarter, why did it happen, and what are we changing in process, coverage, or coaching because of it?”
Review funnel data to refine forecasts
QBRs improve forecasts because they force one shared view of funnel quality. They surface high-value deals, expose immediate risk, highlight repeatable win patterns, and clarify who owns each metric that feeds the forecast.
Forecast confidence callout: If a $250,000 opportunity has sat in Proposal for 41 days, has no confirmed economic buyer, and shows weak activity completeness in Salesforce, that deal should not stay in commit without scrutiny. In a well-run QBR, leadership intervenes right there—either with executive support, a recovery plan, or a forecast downgrade.
QBR formats: structure reviews for sales, CS, and clients
Not every QBR serves the same audience. Sales QBRs focus on quota and pipeline, CS QBRs focus on retention and expansion, and external customer QBRs focus on value delivered and next-quarter goals. The data changes, but the method stays the same: review the facts, diagnose root causes, and leave with a plan.
| QBR type | Timing | Key participants | Primary outcome |
|---|---|---|---|
| Sales QBR | Within 10-14 days after quarter close | CRO, VP Sales, Sales Managers, AEs, RevOps | Clear pipeline assessment, deal prioritization, and next-quarter forecast |
| Customer Success QBR | Within 10-14 days after quarter close | CS leadership, CSMs, Account Managers, Sales leadership, RevOps | Defined risk plans, renewal visibility, and expansion priorities |
| External customer QBR | Quarterly or semi-annually | Customer executive sponsor, business owner, CSM, AM, optional product/support leads | Executive alignment on ROI, adoption, and next-quarter objectives |
Run internal sales reviews for quota
A sales QBR should happen soon after quarter close—usually within 10 to 14 days—while the data is fresh and the next quarter is still recoverable.
- Review attainment: Start with quota attainment, bookings, ACV trends, and segment or regional performance.
- Analyze win/loss patterns: Look at why key deals closed, why others slipped or were lost, and which objections showed up most often.
- Measure cycle health: Review stage conversion, deal velocity, average sales cycle length, and close-date movement.
- Assess current pipeline: Check coverage ratio, stage mix, aging, forecast categories, and top deal risks.
- Set the next-quarter forecast: Separate commit, best case, and upside using evidence, not rep optimism.
- Prioritize execution: Decide which deals need leadership help, which reps need coaching, and where pipeline generation must increase.
RevOps needs to be in the room because someone has to validate the numbers. Without an objective data owner, QBRs drift into rep spreadsheets, conflicting exports, and debates about whose report is “right.”
Assess account health in CS reviews
- Expansion forecast: Review upsell and cross-sell pipeline by segment, product line, and account health.
- Account segmentation: Separate expansion-ready accounts from stable accounts and at-risk accounts.
- Renewal visibility: Review upcoming renewals, commercial timing, and customer-side dependencies.
- Risk mitigation: Create plans for red-flag accounts based on adoption, support escalations, stakeholder changes, or low health scores.
- Feedback trends: Summarize recurring product issues or onboarding gaps that affect retention.
Sales and CS leadership should review this together when renewals and expansion sit across teams. That prevents the usual handoff problem where Sales expects a clean expansion path and CS is still managing product risk or weak adoption.
Prove ROI in external client reviews
An external QBR should show customers the value they’re getting, where adoption can improve, and what both sides will focus on next. It should spend more time on future business goals and roadmap fit than on a recap of support tickets.
| Customer side | Company side |
|---|---|
|
|
The core content is simple: tie your solution to the customer’s business goals, show usage and outcome data, quantify ROI where possible, and agree on next-quarter OKRs.
Leadership roles: drive accountability across the revenue team
QBRs go sideways when RevOps and the CRO show up with different narratives. Before the meeting, they should align on the data set, the key story in the quarter, the areas of disagreement, and the decisions the room needs to make.
| RevOps lane | CRO lane |
|---|---|
| Own the data set, reporting logic, and metric definitions | Own the business decisions tied to the data |
| Surface trends, bottlenecks, and forecast risk | Decide where to shift focus, resources, or management attention |
| Validate Salesforce data quality and reporting accuracy | Set the revenue plan and hold leaders accountable |
| Track post-QBR action items and follow-up cadence | Remove blockers and enforce execution across teams |
Position RevOps as the data provider
- Present pipeline trends: Show coverage, conversion by stage, deal velocity, close-date movement, and forecast category accuracy.
- Report attainment clearly: Break down quota attainment and rep performance by team, region, segment, or manager.
- Find operating bottlenecks: Call out stage stagnation, low activity completeness, process leakage, or poor tech stack usage.
- Audit system reliability: Validate field mapping, activity sync, Salesforce write-back behavior, and report logic before the meeting.
- Track the follow-through: Capture decisions, assign owners, and run the mid-quarter check that keeps the QBR from dying in a slide deck.
RevOps should own the single source of truth in Salesforce. If reps come in with disconnected spreadsheets, copied dashboards, or call data that never wrote back cleanly to opportunity records, the meeting turns into reconciliation instead of decision-making.
Empower the CRO to steer growth plans
- Review growth against target: Check ARR, NRR, GRR, ACV growth, and bookings against plan.
- Align Sales and CS: Make sure new logo, renewal, and expansion motions support the same revenue target.
- Set growth priorities: Decide where to push—new verticals, higher-value segments, pricing changes, or expansion plays.
- Pressure-test the forecast: Review commit risk, pipeline sufficiency, and whether demand generation supports the quarter.
- Manage risk: Identify churn exposure, fragile renewals, or coverage gaps early enough to act.
The CRO’s job in a QBR is to unblock teams and reallocate resources. If the meeting ends with criticism but no decisions on headcount, deal support, territory changes, or pipeline generation, the QBR missed its purpose.
QBR execution: run data-driven meetings that generate action
The highest-leverage change most teams can make is simple: send the pre-read at least three days before the meeting. The live session should be for decisions, not silent reading of charts people are seeing for the first time.
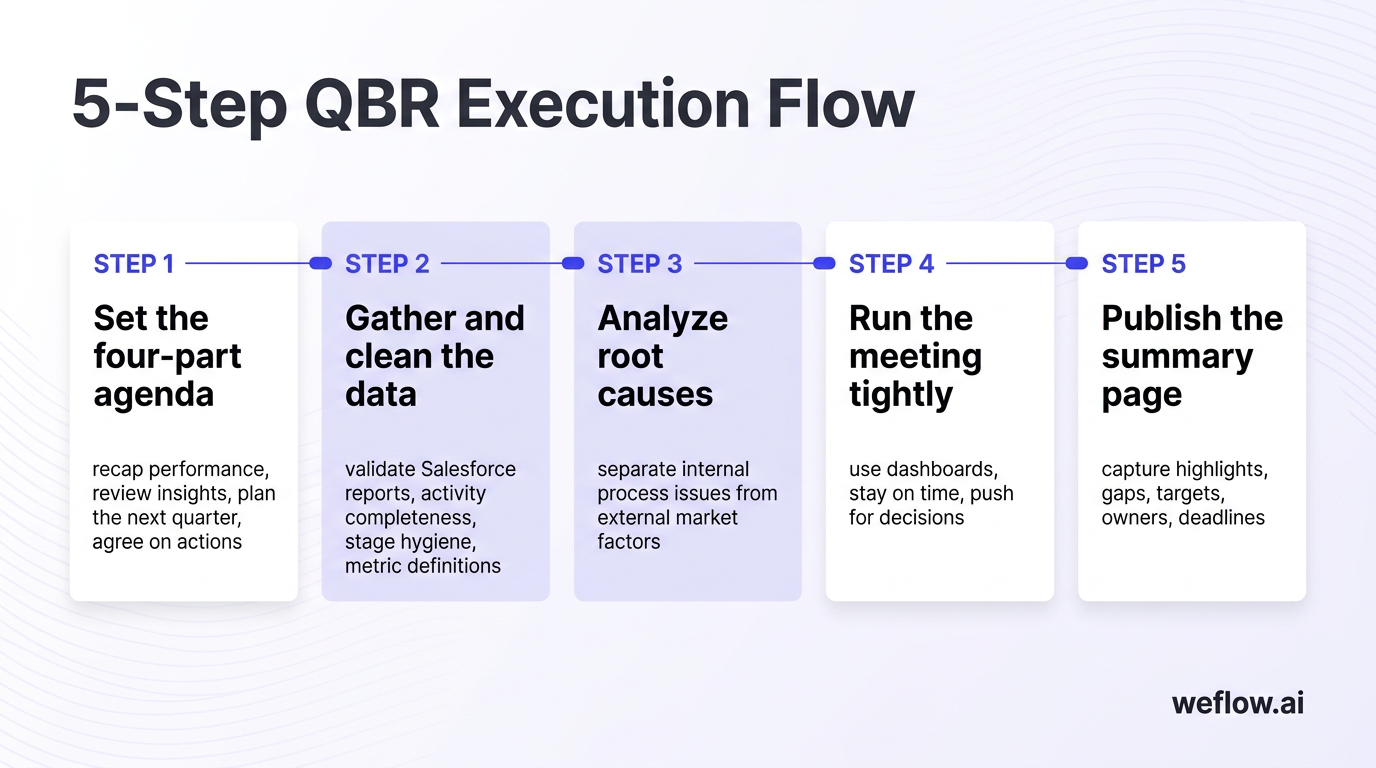
- Set the four-part agenda: recap performance, review insights, plan the next quarter, and agree on actions.
- Gather and clean the data: validate Salesforce reports, activity completeness, stage hygiene, and metric definitions before building the deck.
- Analyze root causes: separate internal process issues from external market factors, and summarize the few lessons that actually matter.
- Run the meeting tightly: keep the group on time, use dashboards instead of raw exports, and push for decisions.
- Publish the summary page: capture highlights, gaps, targets, owners, and deadlines in one page that leadership can revisit.
Set the agenda and gather clean data
- Define success metrics first: Decide which numbers matter before you start pulling reports. Otherwise the team reverse-engineers a story from whatever is easiest to export.
- Validate Salesforce data: Check close dates, amount fields, forecast categories, next-step fields, stage exit criteria, and required MEDDIC or qualification fields.
- Audit activity data: Confirm email, meeting, and call data are writing back to Salesforce records with enough detail to support inspection.
- Review reporting logic: Make sure dashboards use the same filters, date ranges, and ownership rules across Sales, CS, and Finance.
- Incorporate cross-functional input: Pull in feedback from Marketing on lead flow and conversion quality, and from CS on adoption, renewals, and product friction.
- Prepare the pre-read: Send the agenda, charts, metric definitions, and discussion questions at least three days early.
Ignore CRM hygiene here and you get garbage in, garbage out. This is where Salesforce admins and Business Systems teams earn their keep—especially if validation rules, custom objects, or shallow write-back from other platforms are creating reporting gaps.
Analyze wins, losses, and root causes
Keep the story tight. Lead with the must-hit numbers first—bookings target, required pipeline coverage, renewal target, or churn ceiling—then explain what moved them.
| Do this | Not that |
|---|---|
| “We needed 3.2x pipeline coverage and finished at 2.4x in enterprise, so next-quarter risk started 45 days before quarter end.” | “Pipeline was a little light in some areas.” |
| “Win rate dropped 6 points in one segment after average sales cycle length increased by 18 days.” | “Deals got harder.” |
| “Top-of-funnel creation fell after paid spend was cut, so pipeline build missed plan.” | “Marketing didn’t send enough leads.” |
| “Three expansion deals slipped because product adoption was below the health threshold set by CS.” | “Customers weren’t ready.” |
Most teams only need two or three real lessons from the quarter. If everything is a lesson, nothing will change.
Keep the live meeting focused on data
- Start with the objectives, expected decisions, and time limits for each section.
- Use charts, dashboards, and trend views instead of raw spreadsheets that force the room to parse data live.
- Ask probing questions that connect metrics to behavior: Why did stage three conversion drop? Why are renewals healthy in one segment and weak in another?
- Limit the metric set to the numbers that change decisions. More charts rarely mean better judgment.
- Park tactical deep dives that threaten the agenda. Create a follow-up list for rep-level or account-level issues that need a separate working session.
Draft a one-page summary of next steps
| Summary page section | What to include |
|---|---|
| Top 3 highlights | Objective wins tied to revenue, retention, cycle efficiency, or data quality improvement. |
| Top 3 areas to improve | Specific gaps such as low pipeline coverage in enterprise, weak renewal visibility, or poor stage compliance. |
| Goals for next quarter | Visible targets for bookings, NRR, win rate, coverage, cycle length, or churn reduction. |
| Immediate action items | One owner, one due date, and one success metric for each item. |
If an action item doesn’t have a named owner and a deadline, it usually disappears by week two.
Performance tracking: measure retention, pipeline, and growth
You don’t need to track every metric in the business. Pick the five to seven numbers that match your quarterly OKRs and force tradeoffs. That keeps the QBR useful and keeps follow-up manageable.
- Revenue metrics: revenue growth, quota attainment, NRR, GRR
- Sales metrics: pipeline coverage, win rate, average deal size, sales cycle length
- Customer metrics: renewal rate, churn rate, CSAT, customer health score, upsell or cross-sell rate
Track core revenue and pipeline metrics
| Metric | Definition | Why it matters |
|---|---|---|
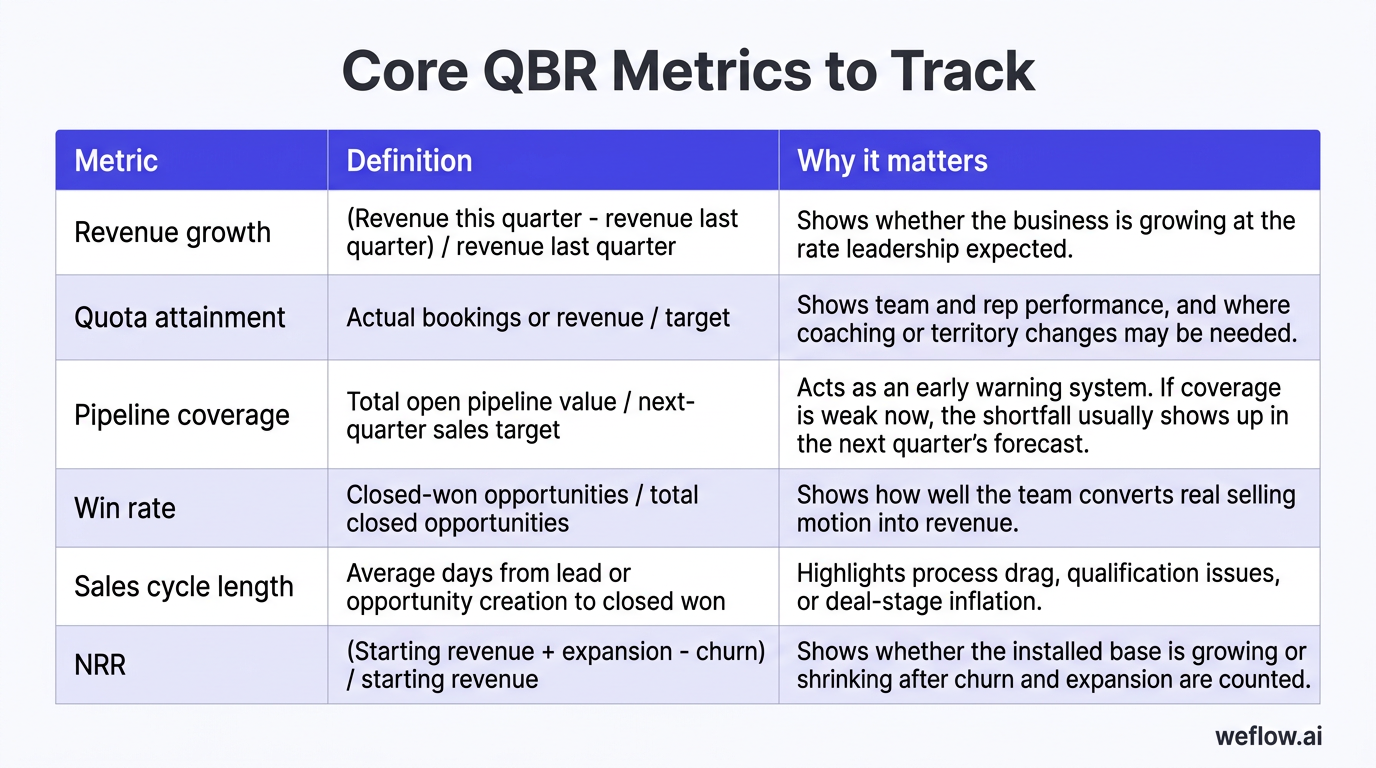
| Revenue growth | (Revenue this quarter - revenue last quarter) / revenue last quarter | Shows whether the business is growing at the rate leadership expected. |
| Quota attainment | Actual bookings or revenue / target | Shows team and rep performance, and where coaching or territory changes may be needed. |
| Pipeline coverage | Total open pipeline value / next-quarter sales target | Acts as an early warning system. If coverage is weak now, the shortfall usually shows up in the next quarter’s forecast. |
| Win rate | Closed-won opportunities / total closed opportunities | Shows how well the team converts real selling motion into revenue. |
| Sales cycle length | Average days from lead or opportunity creation to closed won | Highlights process drag, qualification issues, or deal-stage inflation. |
| NRR | (Starting revenue + expansion - churn) / starting revenue | Shows whether the installed base is growing or shrinking after churn and expansion are counted. |
Define strategic projects with owners
- Process improvements: CRM cleanup, stage-exit enforcement, lead handoff fixes, renewal workflow changes, or forecast inspection rules.
- Tech stack changes: adjust integrations, replace weak activity capture, fix field mapping, or retire tools that create reporting gaps.
- Org alignment work: tighten Sales-to-CS handoffs, update territory design, or set a common definition of expansion readiness.
- Revenue expansion tactics: launch a segment-specific campaign, test new packaging, or prioritize land-and-expand plays for healthy accounts.
Each project needs one named owner even if five teams contribute. Shared ownership sounds collaborative, but in practice it removes accountability.
Solve common reporting and alignment gaps
Your first few QBRs may feel clunky. That’s normal. Most teams are fixing the meeting and the operating system at the same time.
| Challenge | Solution |
|---|---|
| Inconsistent data and reporting silos | Centralize reporting in Salesforce, standardize metric definitions, and automate recurring dashboards so teams stop debating exports. |
| Misalignment between Sales and CS | Use a shared review of renewals, expansion pipeline, and customer health so both teams plan from the same account reality. |
| Low leadership engagement | Align on the questions, decisions, and must-hit numbers before the meeting so leaders show up ready to act, not just listen. |
| Weak follow-up and accountability | Track actions in a shared system, review progress in weekly leadership meetings, and run a mid-quarter checkpoint against QBR commitments. |
FAQ
How long should a quarterly business review take?
Internal QBRs usually take two to four hours depending on team size, segment complexity, and how much decision-making happens in the room. External customer QBRs should usually stay within 45 to 60 minutes, with the detailed analysis handled before or after the meeting.
Who should present data during a sales QBR?
RevOps should present the macro view—pipeline trends, forecast movement, attainment, coverage, and conversion data—because they own the reporting logic. Sales Managers and AEs should then speak to specific deal narratives, rep execution, and recovery plans.
What is the difference between an internal and external QBR?
Internal QBRs focus on quota, pipeline, forecast confidence, retention, and team performance. External QBRs focus on customer ROI, product usage, adoption trends, and shared goals for the next quarter.
How do you prevent a QBR from becoming a status update?
Send historical performance, dashboards, and account context as a pre-read so the meeting starts from a shared baseline. Then reserve the live session for diagnosing root causes, making tradeoffs, and assigning owners.
Which CRM metrics are mandatory for a pipeline review?
The baseline set is pipeline coverage ratio, win rate, average sales cycle length, and quota attainment. In Salesforce, you should also review close-date movement and forecast category accuracy, because both tell you whether pipeline quality supports the number on the board.
.webp)

.webp)
.webp)

.webp)

.webp)
.webp)
.webp)

.webp)