

2023 RevOps Salary Benchmarks to Set Pay by Role and Region [Cheat Sheet]
RevOps compensation is still under-benchmarked compared to sales, marketing, and finance roles. This guide turns data from more than 870 survey submissions into practical salary benchmarks you can use to set pay bands, evaluate offers, or sanity-check your current compensation.
The dataset was collected in partnership with RevOps Co-op and includes 891 submissions, with 876 responses used in the final analysis. If you’re a hiring manager, use it to budget by role, region, and seniority. If you work in RevOps, use it to benchmark your pay against people in similar markets and career stages.
[banner type="download" url="https://www.weflow.ai/content/revops-salary-report" text="RevOps Salary Report 2023" subtitle="See RevOps compensation benchmarks, survey findings, and key takeaways from industry peers." button="Download report"]RevOps market data: understand the talent pool and demand
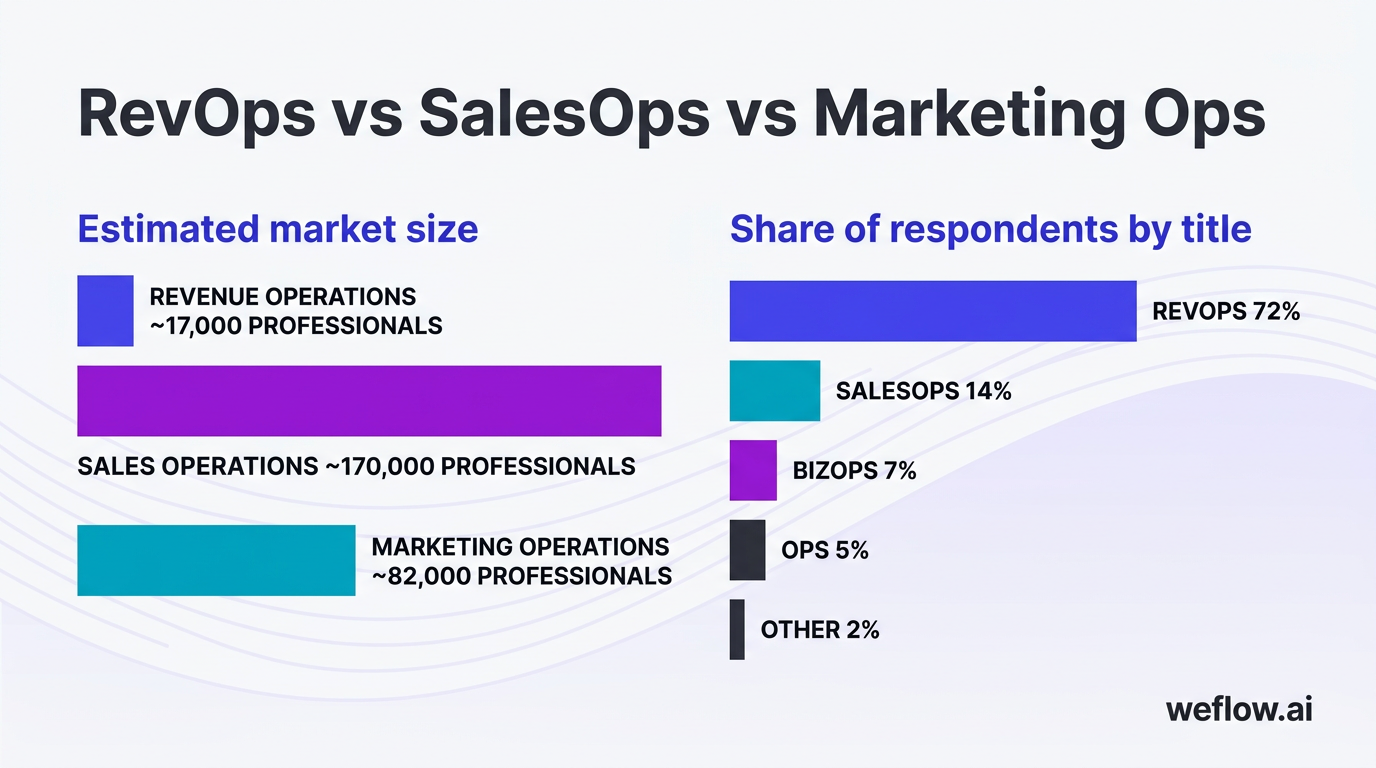
Before you set compensation, it helps to define the market you’re hiring from. RevOps is still a smaller talent pool than Sales Ops or Marketing Ops, which matters because scarcity changes pay expectations fast—especially for experienced operators who can work across systems, process design, analytics, and executive reporting.
The survey data also shows that the market is still standardizing its language. Most respondents had “RevOps” in their title, but a meaningful share still worked under Sales Ops, BizOps, or broader operations titles. That title sprawl makes salary benchmarking harder unless you anchor on scope, reporting line, and actual responsibilities—not just job name.
| Function | Estimated market size |
|---|---|
| Revenue Operations | ~17,000 professionals |
| Sales Operations | ~170,000 professionals |
| Marketing Operations | ~82,000 professionals |
RevOps is the smallest segment in this comparison, but it’s growing faster because companies are moving away from siloed operations teams. Instead of separate owners for sales process, marketing systems, and customer lifecycle reporting, more organizations want one function that can align the full revenue engine.
Define the Revenue Operations function
Revenue Operations is the function responsible for aligning the people, processes, and data behind revenue creation. In practice, that usually means connecting sales, marketing, and customer success so leadership can run on one operating model instead of three separate ones.
RevOps usually doesn’t directly manage quota-carrying teams. It operates as a servant leadership function—setting process, maintaining data quality, driving reporting consistency, and helping commercial teams execute against one plan. That’s one reason compensation can rise quickly: the role sits close to decision-making even when it doesn’t own a large org chart.
- Align sales, marketing, and customer success around shared revenue goals
- Standardize process, reporting, and planning across the funnel
- Improve data accuracy, systems usage, and operational visibility
- Support forecasting, budgeting, territory planning, and performance analysis
- Translate executive priorities into operating cadence and team workflows
Most RevOps professionals report to a CRO, CEO, or CFO. The role also attracts highly technical, solution-oriented operators because the work cuts across systems, analytics, workflow design, and stakeholder management at the same time.
Compare RevOps to Sales and Marketing Ops
For compensation benchmarking, RevOps shouldn’t be treated as a simple rename of Sales Ops. Sales Ops and Marketing Ops still exist as distinct functions, and many companies run both alongside a broader RevOps layer that coordinates the whole go-to-market system.
That distinction matters because RevOps roles often carry wider scope than legacy ops titles. A RevOps manager may own planning, cross-functional reporting, process governance, and strategic analysis that would sit across multiple roles in a more traditional org.
| Title group | Share of respondents |
|---|---|
| RevOps | 72% |
| SalesOps | 14% |
| BizOps | 7% |
| Ops | 5% |
| Other | 2% |
The title winner is clear: RevOps appears in the title for 72% of respondents. Even so, European companies still lean more heavily on traditional Sales Ops and related titles than US companies do, which can make international salary comparisons look lower or less mature than the underlying work actually is.
Global salary benchmarks: align pay with regional standards
The global benchmark in this survey is based on median total compensation, not base salary alone. That includes base pay, variable compensation, and one-time bonuses. Using total compensation makes cross-company comparisons more useful because RevOps pay structures vary widely by stage, geography, and reporting line.
The survey uses the median rather than the mean because income data is skewed. A small number of highly paid leaders at large companies can pull an average upward fast. The median gives hiring managers and candidates a better read on what the middle of the market actually looks like.
Global median total compensation: $120,000
That number is directionally useful, but it’s not a universal local benchmark. North American respondents account for most of the dataset, so the global median lands higher than what many professionals in Europe, LATAM, Southeast Asia, or Africa would see in their home markets.
Review median total compensation worldwide
Across all respondents, the median self-reported total compensation is $120,000. Again, that figure includes base salary, variable pay, and bonuses—not equity, unless the respondent effectively included it in their own self-reporting logic.
If you’re outside the US or Canada, don’t use the global median as your direct target number. Use it as a reference point, then anchor your decision to regional labor markets, cost of living, and the maturity of RevOps as a function in your geography. For many international teams, the more relevant comparison is the regional median below.
Break down salary expectations by geography
Geography is the single biggest pay driver in the dataset. US and Canadian respondents sit at the top of the range, followed by the UK, then Australia and New Zealand, then Europe. LATAM, Southeast Asia, and Africa report lower regional medians, though the data still points to growing RevOps demand in major tech hubs.
| Region | Median total compensation |
|---|---|
| US & CA | $140,000 |
| UK | $100,000 |
| AU & NZ | $89,125 |
| EU (incl. CH + IS) | $75,000 |
| LATAM | $49,998 |
| SEA | $44,000 |
| AFR (KE + SA) | $25,623 |
US and Canada are the top-paying region in this survey. That isn’t just a cost-of-living story. It also reflects where the RevOps title is most established, where more companies have dedicated RevOps teams, and where executive-level operating roles tend to pay more aggressively.
For lower-volume regions, use caution. The report explicitly notes response limitations in Southeast Asia, Africa, and Latin America, so these medians are best used as directional benchmarks rather than rigid pay bands. Even so, tech hubs in places like India and Brazil are becoming more relevant because global SaaS and B2B companies increasingly hire operations talent there.
Compensation drivers: identify factors that multiply earnings
Regional pay sets the outer boundary, but it doesn’t explain the whole market. Within the same geography, the biggest compensation differences usually come from three levers: experience, management responsibility, and reporting structure.
These levers also compound. The people who manage teams often have more experience, and the people with more experience are more likely to report into executive leadership. That’s why top-of-market compensation tends to cluster around strategic operators, not just technically strong individual contributors.
- Experience: income rises quickly in the first five years
- Management scope: people managers tend to earn more than ICs
- Reporting line: roles tied closely to the executive team pay more
Track salary growth by years of experience
RevOps is still a young field, so the experience curve is steep. Newer professionals can move up quickly because there aren’t many long-tenured operators in the market, and companies are willing to pay for people who can combine process design, analytics, systems thinking, and executive communication.
The report’s clearest pattern is this: new starters can effectively double their income within three to five years if they continue expanding their scope and move into more strategic roles.
| Experience level | What the data suggests |
|---|---|
| Up to 1 year | Lowest earning band, but fastest growth potential |
| 2–3 years | Early scale-up phase for compensation and responsibility |
| 4–5 years | Point where many professionals have roughly doubled early earnings |
| 6–7 years | Higher strategic ownership becomes more common |
| 8–10 years | Leadership-track compensation becomes more typical |
| 10+ years | Smallest group, often in top-paying roles |
Experience distribution helps explain why senior talent is expensive:
- About 45% of respondents have 2–5 years of relevant experience
- 30% have 6–10 years of experience
- Only 13% have 10+ years of experience
There are so few 10+ year veterans partly because the RevOps title itself is still relatively new. Many people doing RevOps-level work a decade ago would have been titled Sales Ops, Business Operations, or Strategy and Operations instead.
Assess the financial impact of team management
Management responsibility is another clear pay divider. The report doesn’t assign a single universal premium in dollars, but it does show that managing a team is associated with higher earnings and broader role scope.
| Track | Share of respondents | Compensation signal |
|---|---|---|
| Individual contributors | 58% | More common in earlier-stage or narrower-scope roles |
| Managers of 2+ people | 42% | Higher pay tends to follow broader accountability |
Managers are the higher-paid track. That makes sense operationally: they’re usually responsible not just for execution, but for prioritization, cross-functional alignment, hiring, team development, and executive communication. The pay bump reflects more pressure as much as more authority.
There’s also a company maturity effect here. If a business can support a multi-person RevOps team, it usually has a larger budget, more systems complexity, and a stronger need for formal forecasting and planning. Those conditions tend to lift compensation for managers first.
Map reporting structures to higher base pay
Who RevOps reports to changes both the job and the pay. Roles that sit inside Sales or a RevOps department are more common. Roles tied directly to the executive team are less common, but they tend to carry more strategic weight and higher compensation.
| Department | Share of respondents |
|---|---|
| Revenue Operations | 35.1% |
| Sales | 29.5% |
| Operations | 10.9% |
| Finance | 8.7% |
| Marketing | 8.7% |
| Customer Success | 1.3% |
| Product | 0.6% |
The regional cut makes the strategic pattern even clearer:
| Department | Regional share |
|---|---|
| Revenue Operations | 44.3% |
| Sales | 18.3% |
| Executive Team / Founders | 14.5% |
| Operations | 11.5% |
| Marketing | 5.3% |
| Finance | 3.8% |
| Product | 1.5% |
Reporting to executive leadership is the best-paying structure. The reason is straightforward: when RevOps reports to the CRO, CFO, CEO, or founders, the role is treated as strategic infrastructure for planning and growth—not just tactical support for one department.
Company demographics: target industries that pay market rates
RevOps compensation also depends on where the role sits. Industry, company size, work mode, and equity all shape total pay. For most professionals in this survey, the center of gravity is clear: software companies, mid-sized B2B organizations, and remote work arrangements.
That doesn’t mean every SaaS company pays the most. It means SaaS and IT make up most of the market, so they set the benchmark. Some less common industries can pay above-market for the right operator because the talent supply is thinner.
Target software and IT for maximum earnings
The RevOps market is still dominated by software and IT. According to the survey, 84% of respondents work in software development or IT-related companies. That concentration matters because it shapes everything from job design to compensation norms.
- Software / SaaS / IT — dominant employer category and the main compensation benchmark
- Health care — smaller share, but can pay well for specialized operators
- Media — less common, but included among higher-paying alternatives
- Telecommunications, hospitality, and information — present, though with lower respondent volume
Software and IT are the most reliable target industries for strong RevOps pay. That said, non-SaaS sectors sometimes offer higher median incomes because experienced RevOps talent is harder to find there, and the role may be tied directly to transformation or scale initiatives.
Evaluate pay scales across company sizes
Company size shapes compensation, but not always in the way people expect. Large companies can usually pay more in base and variable compensation. Still, the survey notes that pay differences across companies with 51 to 5,000 employees are smaller than many would assume.
The bigger story is adoption. RevOps is most common in mid-sized companies where the go-to-market motion has become too complex for founder-led spreadsheets, but not so large that every function is still handled in a rigid silo.
| Company size | Share of respondents |
|---|---|
| 51–200 employees | 42% |
| 201–500 employees | 21.2% |
| 501–1000 employees | 13.6% |
| 11–50 employees | 11.6% |
| 1001–5000 employees | 6.8% |
European company-size distribution is similar, though slightly more weighted toward smaller employers:
| Company size | EU share of respondents |
|---|---|
| 51–200 employees | 39.7% |
| 201–500 employees | 20.6% |
| 11–50 employees | 16.8% |
| 501–1000 employees | 7.6% |
| 1001–5000 employees | 6.9% |
Companies with 51–200 employees are the core hiring market for RevOps. These are often Series A to C companies that need process discipline, planning rigor, and cross-functional reporting, but aren’t yet staffed like large enterprises.
Very small companies often haven’t specialized enough to justify a dedicated RevOps role. Massive enterprises often still rely on more traditional Sales Ops, Marketing Ops, and business systems structures, even when the work looks RevOps-like in practice.
Factor remote work and equity into total pay
Remote work is one of the clearest non-title compensation signals in the report. Most respondents work remotely, and they also report the highest median total compensation.
| Work mode | Share of respondents | Median total compensation |
|---|---|---|
| Fully Remote | 66.9% | $130,000 |
| Hybrid | 25% | $110,000 |
| Fully In-Office | 8.1% | $97,000 |
Remote roles pay the most in this survey. The gap is large enough to matter for both hiring managers and candidates. If your compensation band assumes office-based local-market pay, remote-first candidates may price above it.
The report also shows that non-salary benefits remain material:
| Benefit | Share |
|---|---|
| Educational budget offered | 50.7% |
| No educational budget | 49.3% |
| Stock options | 52.4% |
| RSUs | 16.9% |
| No equity | 30.5% |
| Both stock and RSUs | 0.2% |
The remote premium likely reflects more than work preference. Remote RevOps roles often open access to US-based employers, larger hiring pools, and broader-scope positions that might not exist in a candidate’s local office market.
Top earner profiles: replicate traits of highest-paid leaders
The top end of the market isn’t random. The highest-paid respondents in this report share a consistent profile across experience, location, title, company size, industry, and work mode. That makes the data useful not just for benchmarking current compensation, but for mapping career progression.
For hiring managers, the implication is simple: if you want a candidate with every one of these traits, you should expect to pay top-of-market rates. This is the scarcest part of the talent pool.
Match the six characteristics of VP-level earners
- 10+ years of experience
- Remote work
- Software / IT industry
- Based in the US
- Vice President title
- Company size: 200–500 employees
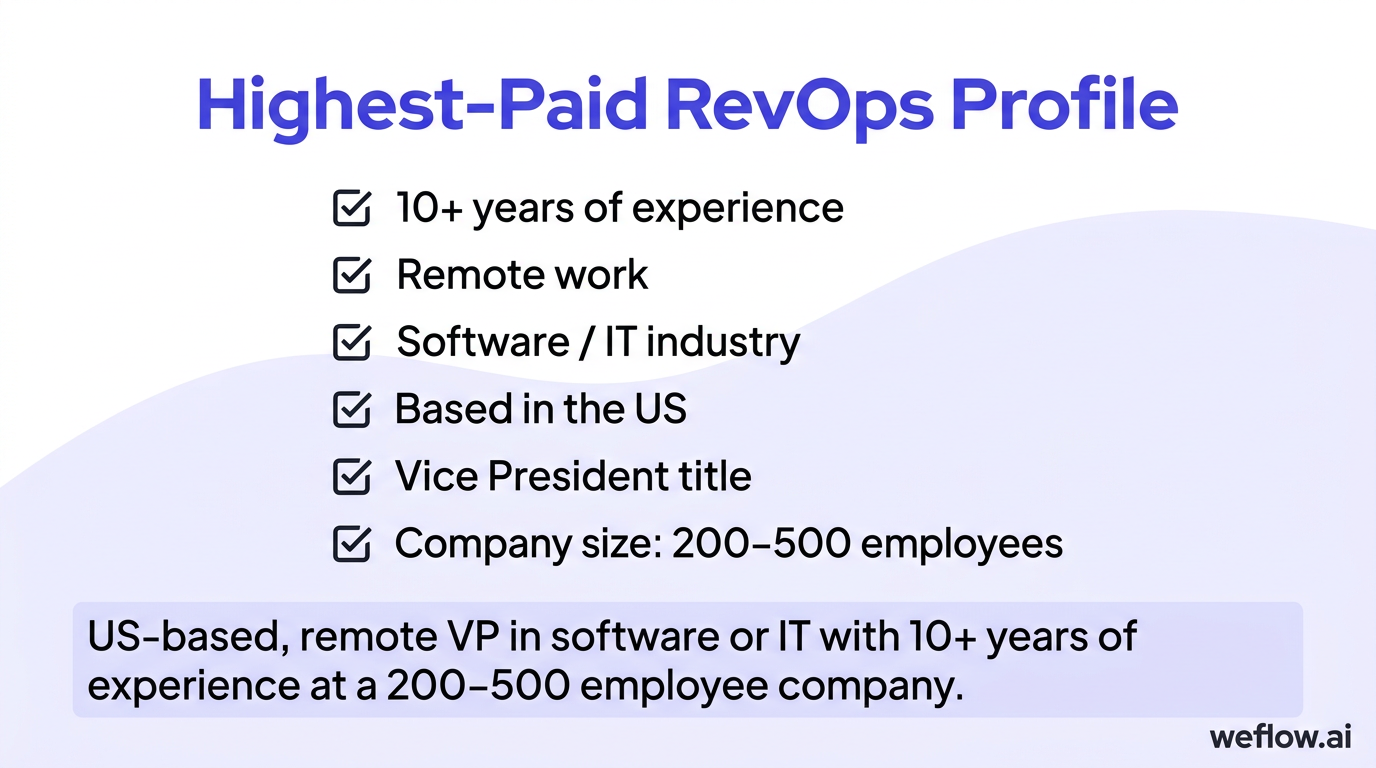
The highest-paid profile is a US-based, remote VP in software or IT with 10+ years of experience at a 200–500 employee company.
If you’re earlier in your career, this profile works as a roadmap. The common progression is to build technical depth first, then broaden into planning, leadership, and executive-facing work. The market pays most for operators who can move from fixing process to shaping company-level decisions.
RevOps compensation trends: finalize your hiring strategy
The strongest compensation drivers in this dataset are geography, experience, management scope, reporting line, and work mode. If you’re setting salary bands, don’t benchmark only by title. A “RevOps Manager” in North America reporting to the CRO at a remote-first software company is not the same market as a tactically scoped operations manager inside a regional sales org.
For employers, the practical next step is to review existing pay bands against the market signals that most often move candidates in or out of process—especially remote eligibility, equity participation, and executive alignment. For candidates, the takeaway is just as clear: the fastest compensation growth comes from stacking strategic scope on top of technical skill.
- Use regional medians before global medians when setting compensation
- Adjust pay bands for experience and management responsibility, not title alone
- Treat reporting to the CRO, CFO, or CEO as a higher-value role design
- Benchmark remote pay and equity separately from in-office compensation
- Expect top-of-market candidates to come from US-based software companies with executive exposure
FAQ
What is the median salary for a RevOps professional?
The global median total compensation in this survey is $120,000. That figure includes base salary, variable pay, and bonuses, and it’s weighted upward by the heavy concentration of US and Canadian respondents.
Does remote work affect Revenue Operations pay?
Yes. Fully remote respondents reported a median total compensation of $130,000, compared with $110,000 for hybrid workers and $97,000 for fully in-office workers. Remote roles also make up the majority of the market, not a niche segment.
How much experience is needed to double RevOps income?
The survey suggests many RevOps professionals can effectively double their income within three to five years. That jump usually comes from moving beyond execution into broader ownership across planning, analytics, and cross-functional operations.
Which departments should RevOps report to for higher pay?
Roles that report directly to executive leadership—most commonly the CRO, CFO, CEO, or founders—tend to pay more than roles nested deeper inside a single department. Those reporting lines usually signal that RevOps owns strategic planning and revenue visibility, not just tactical support.
.webp)

.webp)
.webp)

.webp)

.webp)
.webp)
.webp)

.webp)