

10 RevOps Board Reporting Practices That Flag Risks and Guide Decisions [Framework]
Board reporting isn’t a deck-building exercise. It’s where RevOps helps the CRO explain what’s happening in the go-to-market system, what’s likely to happen next, and where the board needs to make decisions.
This framework covers the 10 practices that make board reporting useful: a clean data foundation, early-warning pipeline signals, capacity models tied to revenue, and a narrative that turns raw metrics into board-level decisions.
Board reporting foundation: align data to avoid metric debates
“Good RevOps people do not just report metrics. They are the CRO's eyes and ears and can shape the GTM system that decides whether the company scales.”
— John McMahon, 5x CRO & previous board member at Snowflake and MongoDB
That’s the real job. If ARR, NRR, CAC payback, or pipeline coverage mean different things in Salesforce, BI, and Finance, the board meeting turns into a debate about whose dashboard is right. Once that happens, strategy is gone. You’re spending board time reconciling definitions instead of discussing pipeline gaps, hiring risk, or pricing pressure.
RevOps owns the baseline: one source of truth across Salesforce, BI, and Finance, plus the hygiene checks that make the numbers defensible. A metrics glossary sounds boring until a CAC payback slide creates panic because Sales excluded expansion revenue and Finance didn’t. Good board reporting starts before the deck exists.
Standardize definitions across your CRM and BI
Start with the data foundation, not the deck. This is the checklist RevOps should run before any board pack gets built:
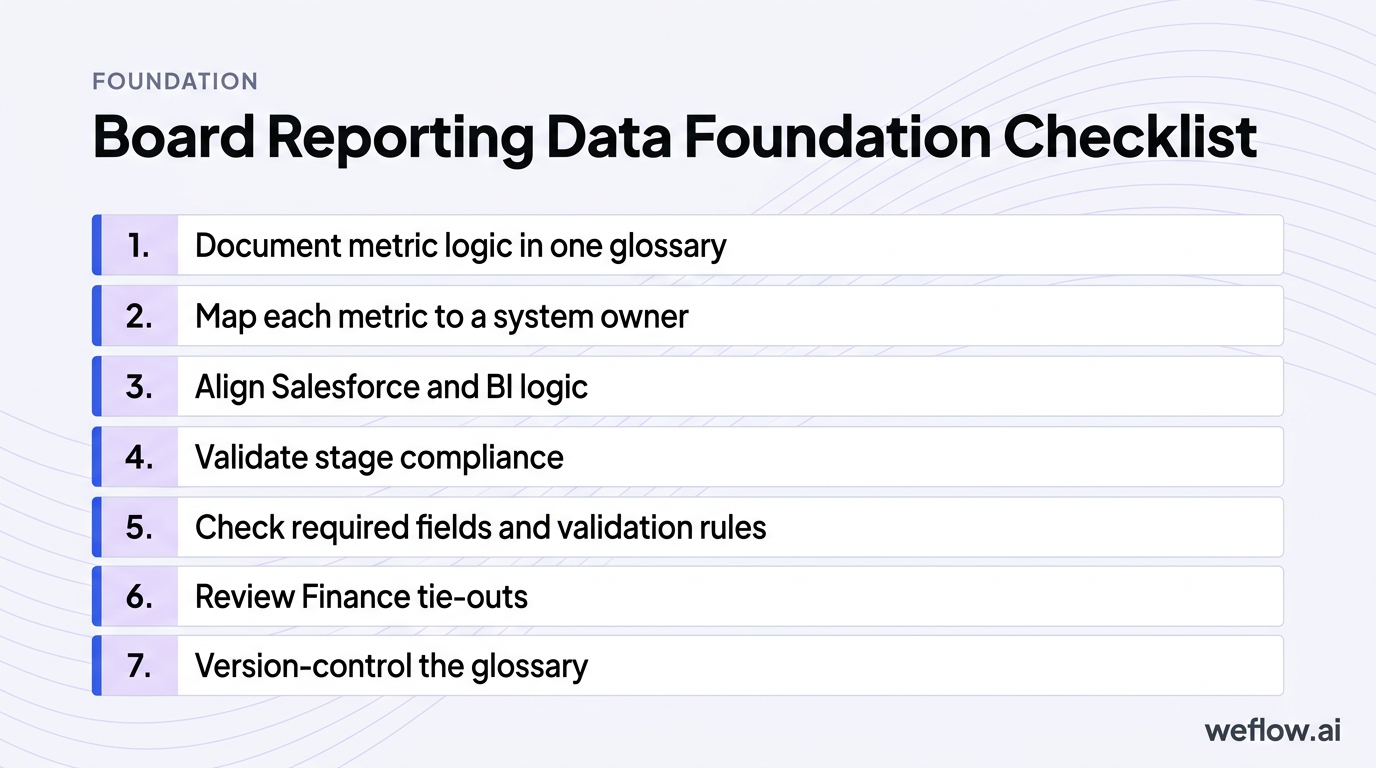
- Document metric logic in one glossary: define ARR, NRR, CAC payback, pipeline coverage, forecast categories, and productivity metrics with clear inclusions and exclusions.
- Map each metric to a system owner: Salesforce field, BI model, Finance source, and the person who signs off on changes.
- Align Salesforce and BI logic: if Tableau or Looker calculates pipeline coverage differently from Salesforce reports, fix that before board week.
- Validate stage compliance: confirm reps are using the right stage definitions, exit criteria, forecast categories, and close dates.
- Check required fields and validation rules: make sure fields like segment, geo, product line, primary campaign source, and forecast category are populated and governed.
- Review Finance tie-outs: confirm booked ARR, churn, and expansion logic match Finance reporting.
- Version-control the glossary: if a formula changes, document when it changed and why.
One common failure point: CAC payback. Sales may define it as sales and marketing spend divided by new business ARR. Finance may include or exclude certain costs, or treat expansion differently. If that mismatch hits the board deck, the room can read a normal change in formula as a real efficiency problem. A metrics glossary prevents false alarms.
Automate data capture to eliminate manual decks
Manual board reporting creates two problems at once: bad numbers and lost time. RevOps teams often spend the days before board week exporting Salesforce reports, checking formulas in spreadsheets, fixing stale close dates, and answering last-minute “which number is correct?” questions. That’s time you should spend explaining why the business moved, not rebuilding a spreadsheet.
This is also where Salesforce architecture matters. If activity data sits outside core reporting objects—as it often does with Salesforce Einstein Activity Capture (EAC)—your board deck may rely on partial data or manual reconciliations. Live dashboards tied to Salesforce reporting and revenue analytics cut that problem down fast.
| Manual decks | Automated dashboards |
|---|---|
| Data is exported into spreadsheets and presentation slides | Metrics pull from live Salesforce and BI layers |
| Formula errors and copy/paste mistakes show up late | Metric logic is controlled in one reporting layer |
| Close dates, stages, and forecast categories go stale between exports | Board views refresh from current pipeline data |
| RevOps spends board week checking cells | RevOps spends board week on root-cause analysis and talking points |
| Leaders argue over which file is latest | Leaders work from one shared source of truth |
Pipeline visibility: surface early-warning signals for the CRO
Boards trust CROs who see the gap early and explain the recovery plan. That means board reporting has to move past lagging outcomes and show pipeline health: coverage ratios by segment and geo, ASP trends in new business versus expansion, deal movement across the quarter, and signs of stall before the number misses.
The goal isn’t to flood the board with funnel charts. It’s to show which part of pipeline health is changing, what that means for the forecast, and whether leadership is already acting on it.
Track pipeline waterfalls to visualize deal movement
Pipeline waterfall: a period-over-period bridge that explains how pipeline changed through new opportunities, amount increases, amount decreases, pulled-in deals, slipped deals, closed-won, closed-lost, and churn or contraction where relevant.
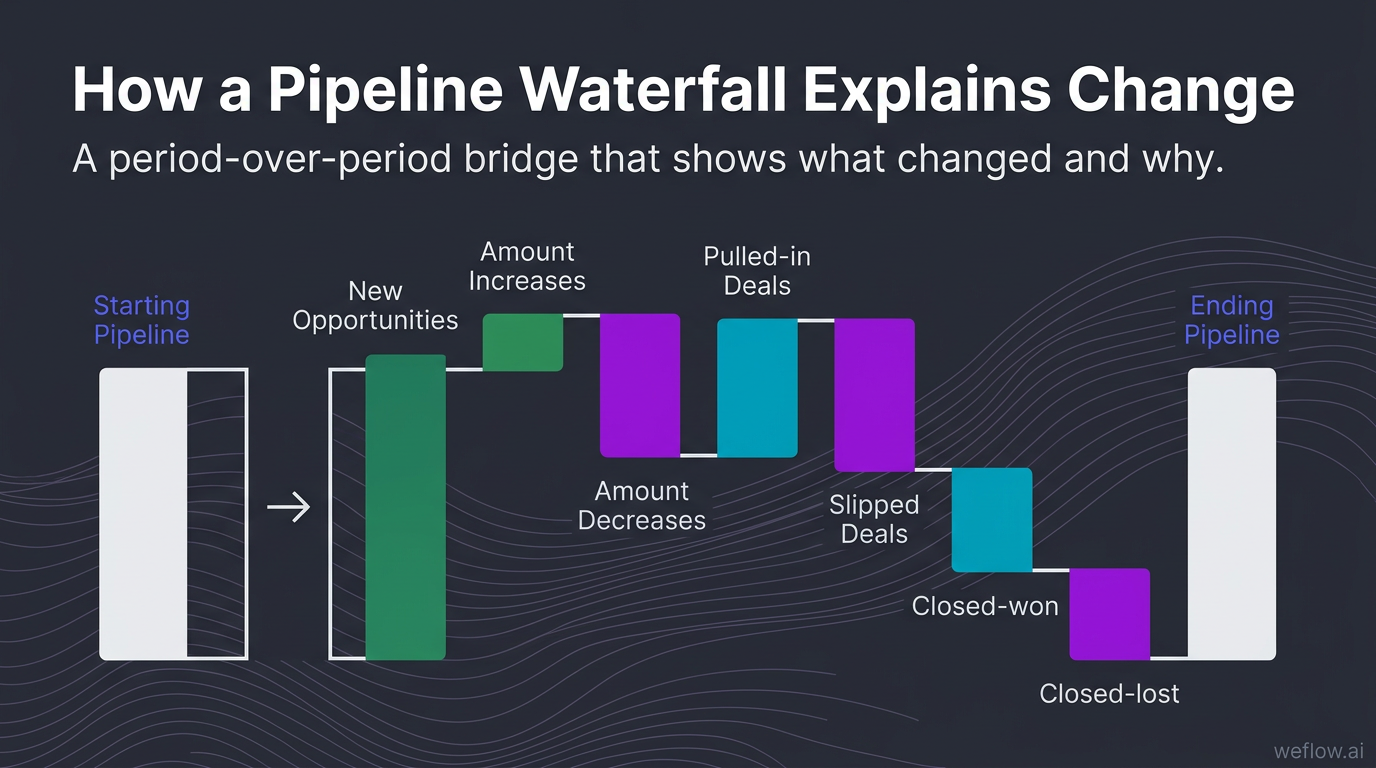
A pipeline number by itself doesn’t help much. A waterfall does. It tells the board whether the pipeline grew because of real creation, because deal sizes expanded, or because close dates slipped into the future. It also makes forecast shifts easier to explain in one view.
When you present a waterfall, narrate the drivers, not just the ending balance. For example: “Coverage fell from 3.4x to 2.8x in enterprise. The biggest driver was $2.1M in slips from stage 4 into next quarter, partially offset by $900K in new pipeline. This isn’t a top-of-funnel issue yet—it’s late-stage execution and approval timing.” That kind of explanation gives the board something to react to.
Monitor stage conversion to identify funnel leakage
If the board asks why sales cycle length is up or forecast confidence is down, stage conversion data usually has the answer. Track these three metrics first:
- Stage-to-stage conversion rate by segment, territory, and industry to find where deals stop progressing.
- Average time in stage to spot approval, pricing, security review, or procurement bottlenecks.
- Pipeline velocity to measure how quickly qualified opportunities move toward revenue.
This is where RevOps becomes useful to the CRO. If conversion from discovery to evaluation drops in one region, that may point to qualification quality or messaging drift. If time in legal review spikes for enterprise deals, that’s a process problem, not a rep effort problem. RevOps should turn those patterns into recommendations: tighten stage exit criteria, update MEDDIC enforcement in Salesforce, change approval workflows, or target enablement where the leakage actually sits.
Flag at-risk opportunities before they impact revenue
Boards don’t expect perfect forecasts. They do expect early visibility into risk. RevOps should build a simple operating view that shows which deals are slowing down, why they’re slowing down, and what management is doing about it.
| Risk signal | RevOps action |
|---|---|
| Close date pushed more than once in 30 days | Review stage validity, confirm buyer timeline, and remove inflated commit classifications |
| No next step logged on a late-stage opportunity | Trigger manager inspection and require next-step field completion in Salesforce |
| Buyer engagement drops across meetings and email replies | Flag deal momentum risk and push for multithreading or executive outreach |
| Activity capture is incomplete on key accounts | Audit sync logic, restore activity completeness, and reassess forecast confidence |
| Forecast category doesn’t match stage or deal evidence | Enforce forecast hygiene rules and recalibrate manager rollups |
At-risk views get stronger when you compare forecast versus actuals over time. If slips and stale next steps show up repeatedly before misses, you’ve found a usable leading indicator. That’s what the board wants: not perfect prediction, but proof that leadership can see trouble before quarter-end.
Team performance: tie headcount models to revenue capacity
Revenue targets without a capacity model are just opinions. The board may approve aggressive growth, but RevOps has to show the math behind it: planned hires, actual hires, ramping reps, full productivity timelines, attrition, manager coverage, and the productivity assumptions underneath the plan.
This matters because “we hired to plan” can still hide a future miss. If ramp time stretches, managers are overloaded, or new reps get weak territories, headcount growth won’t translate into revenue capacity.
Break down quota attainment by ramped versus new reps
A blended quota attainment number hides too much. If attainment falls from 68% to 61%, the board needs to know whether the mature core team weakened or whether a big hiring class is still ramping. Those are two different stories and two different fixes.
Segment quota attainment by:
- Tenure: ramping versus fully ramped reps
- Region: North America, EMEA, APAC, or your operating model
- Segment: SMB, mid-market, enterprise
- Manager: to spot coaching and leadership variance
- Business type: new logo versus expansion
This is also how you decide where to add headcount safely. If fully ramped enterprise reps under Manager A produce 1.8x the ARR of peers with similar territory potential, that team may absorb new hires better than a region still struggling with ramp and conversion.
Compare actual ramp times against your capacity model
Modeled ramp time is a planning assumption. Actual ramp time is the truth. RevOps should compare the two every quarter and show the revenue effect of any gap. If the model says six months to full productivity and reality is eight, you haven’t missed hiring targets—you’ve missed capacity.
Metric spotlight: Ramp Time Actuals
Track rep tenure against peak productivity, compare modeled ramp to actual attainment, and correlate activity levels like meetings, emails, and opportunity creation with outcomes. If reps are active but not converting, the issue may be onboarding quality, manager coaching, territory fit, or deal qualification—not effort.
Extended ramp times quietly erode future quarters. That’s why this belongs in the board deck, not just the CRO’s weekly review.
Evaluate manager-to-rep ratios to prevent team churn
Warning: manager span of control looks like an org-chart issue until it shows up as slow ramp, weak inspection, and rep attrition. A common threshold is 1:6, but the right ratio depends on segment complexity, sales cycle length, and how much deal inspection managers are expected to do.
Tip: pair manager-to-rep ratios with territory allocation data. Overloaded managers plus uneven books is a reliable way to create churn and missed numbers at the same time.
When the board sees weak productivity, RevOps should be ready to explain whether the root cause is hiring quality, enablement, territory design, or manager bandwidth. That kind of diagnosis changes the conversation from “why are we missing?” to “what do we fix first?”
Strategic narrative: translate raw metrics into board decisions
Most board packs have too much data and not enough point of view. RevOps should curate five to seven metrics that matter, show the trend, explain the root cause, and draft the narrative the CRO will use in the room. Data without a story just creates more questions.
The narrative should connect operating inputs to business outcomes: ramp delays, training gaps, competitor pressure, new product adoption, pricing shifts, and churn signals. That’s how the board gets from inspection to decisions.
Connect lagging revenue outcomes to leading indicators
Lagging metrics tell the board what happened. Leading indicators tell them why it happened and what may happen next.
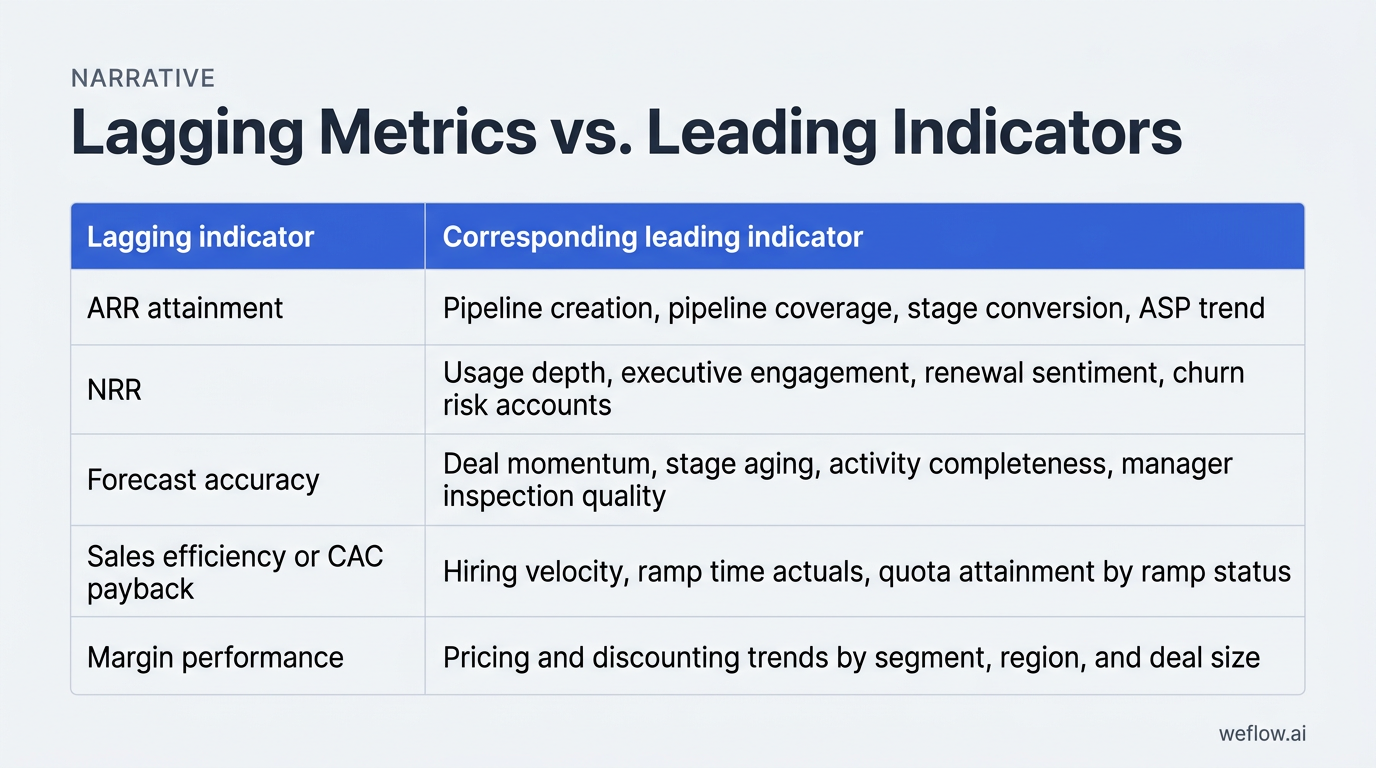
| Lagging indicator | Corresponding leading indicator |
|---|---|
| ARR attainment | Pipeline creation, pipeline coverage, stage conversion, ASP trend |
| NRR | Usage depth, executive engagement, renewal sentiment, churn risk accounts |
| Forecast accuracy | Deal momentum, stage aging, activity completeness, manager inspection quality |
| Sales efficiency or CAC payback | Hiring velocity, ramp time actuals, quota attainment by ramp status |
| Margin performance | Pricing and discounting trends by segment, region, and deal size |
A simple example: if pipeline creation drops in Q2, the ARR miss may not show up until Q3 or Q4 depending on your sales cycle. RevOps should make that chain explicit. “New pipeline creation in enterprise fell 22% in May and June. With a 75-day average cycle, we expect that to pressure Q3 new ARR unless coverage recovers this month.” That’s the kind of sentence a board can work with.
Build five-quarter rolling views to highlight trends
Five-quarter views are better than four-quarter or year-to-date views because they show both sequential movement and the same quarter last year. That matters when seasonality is real. If Q4 is always heavy and Q1 always resets, a five-quarter view gives the board context without making you explain the calendar every meeting.
Build five-quarter views for:
- ARR and NRR
- Pipeline coverage and pipeline creation
- Forecast versus actuals
- Rep productivity and quota attainment
- Ramp time actuals and headcount versus plan
- Churn, expansion, and logo mix
- Market or segment mix
- Pricing and discounting trends
Trend-based reporting is harder to dispute because it shows direction, not just one isolated number someone doesn’t like.
Draft executive talking points with clear board asks
Good board meetings end with decisions made, not slides reviewed. RevOps should help the CRO structure the discussion in three steps:
- Context: what changed in revenue, pipeline, productivity, or retention this quarter?
- Risks: what early-warning signals matter most, and what’s driving them?
- Asks: where does leadership need board input, approval, or alignment?
That last step matters most. If competitor mentions are rising in enterprise, the ask may be a pricing review or product packaging decision. If ramp time is extending, the ask may be approval for manager hires or enablement investment. RevOps should convert frontline friction into strategic questions the board can actually help answer.
AI revenue intelligence: scale insights without manual effort
AI only helps board reporting if it improves data completeness, pipeline visibility, and forecast confidence inside Salesforce. If it creates another data silo, it adds work. The useful categories are straightforward:
- Conversation intelligence: captures call themes like competitor mentions, common objections, buying signals, and sentiment so the CRO can explain win-rate shifts and churn risk with evidence.
- Pipeline management: tracks pipeline waterfalls, stage progression, slips, pulled-in deals, and coverage by segment or geo in real time.
- Sales forecasting: compares forecast versus actuals, monitors commit accuracy, and highlights deals that don’t have the activity or momentum to support the call.
- Activity capture: writes emails, meetings, and engagement signals back to Salesforce so reporting isn’t built on partial rep-entered data.
For Business Systems teams, the test is simple: does the platform work with your Salesforce data model, respect field-level security, support Salesforce Enterprise or Unlimited editions, and deploy in weeks, not quarters? Weflow, a Salesforce-native revenue AI platform, is built for that operating model. It captures activity and conversation data directly in Salesforce, supports deeper field mapping and Salesforce write-back, and helps teams push activity completeness above 95% without another tab-heavy workflow.
This also matters if you’re migrating from Gong. Gong is strong in Conversation intelligence, but many RevOps teams still end up filling gaps with manual workarounds because Salesforce write-back is limited, field mapping is shallow, and board reporting still depends on side-system exports. If your goal is board-ready pipeline and forecast reporting in Salesforce, Weflow is the better fit. The migration project is usually lighter than teams expect because the hard part isn’t changing the UI—it’s defining the Salesforce fields, sync logic, and historical reporting requirements you should have standardized already.
Look for enterprise basics too: managed-package deployment, support for custom objects where needed, SOC 2 Type II, and a controlled integration footprint that won’t create API limit surprises during quarter-end reporting.
FAQ
What metrics should RevOps include in a board deck?
Start with 5-7 metrics: ARR, NRR, pipeline coverage, forecast versus actuals, CAC payback, quota attainment split by ramp status, and ramp time actuals. Pair each with one leading indicator so the board sees both outcome and cause.
How far back should board reporting trends look?
Use a five-quarter rolling view. It shows sequential movement, the same quarter last year, and seasonality in one frame. Four quarters often miss the context boards need to judge whether a change is structural or just calendar-driven.
How can RevOps prevent surprises in board meetings?
Build early-warning dashboards for pipeline gaps, deal slippage, stale late-stage opportunities, churn risk accounts, and hiring-to-ramp delays. Then review them weekly with the CRO, not just before the board meeting.
What is the difference between lagging and leading metrics?
Lagging metrics show past outcomes, like ARR, churn, or closed revenue. Leading metrics show inputs that predict those outcomes, like pipeline creation, hiring velocity, ramp time, stage conversion, activity completeness, and deal momentum.
.webp)

.webp)
.webp)

.webp)

.webp)
.webp)
.webp)

.webp)