

Annual GTM Planning Framework to Build Capacity Models and Set Realistic Targets [Step-by-Step]
Annual GTM planning breaks down when each function builds its own spreadsheet, works from different assumptions, and tries to force alignment in December. By then, headcount plans are late, quota models are shaky, and Salesforce still isn’t ready for a January 1 go-live.
RevOps should own this process. You sit closest to the data, the planning mechanics, and the systems that turn targets into field execution. This guide walks through the timeline, capacity modeling workflow, pipeline coverage math, performance audits, cross-functional workshops, and tech stack checks you need to turn annual planning into an operating system—not a Q4 fire drill.
[banner type="download" url="https://www.weflow.ai/content/annual-planning-cheat-sheet" text="Annual GTM Planning & Capacity Modeling Cheat Sheet" subtitle="Get planning frameworks, capacity model prompts, quick-win checklists, and success indicators." button="Download now"]GTM planning timeline: align stakeholders and hit Q1 targets
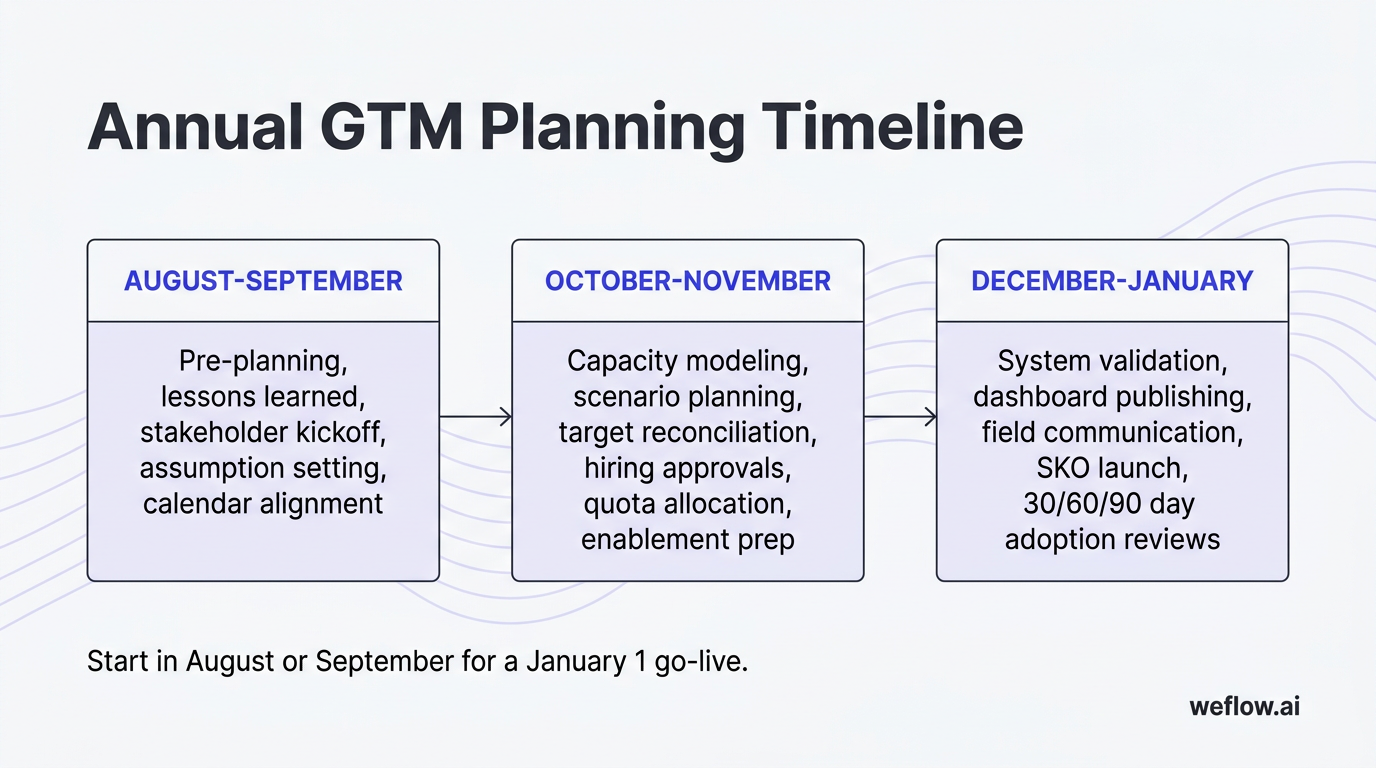
If you want the plan live on January 1, planning needs to start in August or September. That gives enough time to audit last year’s actuals, reconcile top-down targets with bottom-up capacity, lock hiring plans with HR and Talent Acquisition, update compensation models, test Salesforce automations, and get managers ready to run the plan in Q1.
Late starts create a predictable chain reaction: Finance sets a number, Sales pushes it down, Marketing gets a pipeline target after budgets are mostly fixed, and RevOps inherits the cleanup. The fix is a shared calendar, named owners, and clear decision points by month.
- August-September: Pre-planning, lessons learned, stakeholder kickoff, assumption setting, and calendar alignment.
- October-November: Capacity modeling, scenario planning, target reconciliation, hiring approvals, quota allocation, and enablement prep.
- December-January: System validation, dashboard publishing, field communication, SKO launch, and 30/60/90 day adoption reviews.
| Stakeholder | Primary responsibility | Core deliverable | Must engage by |
|---|---|---|---|
| RevOps | Own planning cadence, model logic, and decision process | Master timeline, planning templates, capacity model | August |
| CRO | Set revenue ambition and approve scenarios | Target range, hiring priorities, scenario sign-off | August |
| CMO | Commit pipeline creation targets and budget inputs | Lead gen plan, channel assumptions, campaign budget asks | September |
| FP&A | Set budget guardrails and corporate planning assumptions | Budget ceilings, cost model, planning calendar dependencies | September |
| Head of CS | Own renewal and expansion assumptions | GRR, NRR, churn assumptions, renewal forecast | September |
| HR / Talent Acquisition | Validate hiring lead times and recruiter capacity | Recruiting timeline, backfill plan, candidate funnel assumptions | October |
| Sales managers | Pressure-test quota and territory feasibility | Role productivity feedback, segment risk flags | October |
Three quick wins keep the timeline on track: publish the calendar early, put recurring review sessions on the calendar before the model is built, and define who has decision rights versus who is only consulted. Most planning delays come from ambiguity, not bad math.
Map the pre-planning phase for August and September
Before anyone starts modeling quotas or headcount, you need clean inputs and a shared process. This phase is where RevOps earns credibility—by forcing alignment before numbers harden.
- Publish the unified GTM planning calendar. Include milestones, owners, dependencies, and approval dates across Sales, Marketing, CS, Finance, and HR.
- Write a short planning mission statement. One paragraph is enough. Tie the process to revenue attainment, forecast confidence, and execution readiness in Salesforce.
- Host the cross-functional kickoff. Review scope, assumptions, deadlines, and decision rules. Leave with agreement on inputs, not just attendance.
- Run the prior-year post-mortem. Compare plan versus actual by headcount, ramp, win rate, pipeline coverage, renewal performance, and quota attainment.
- Document the top three planning lessons. Keep them specific: “Enterprise ramp took 10 months, not 6,” is useful. “We need better alignment,” isn’t.
- Freeze planning definitions. Lock terms like pipeline, qualified pipeline, fully ramped AE, renewal ARR, and commit category so each team uses the same logic.
If a stakeholder misses an early deadline, don’t let the entire model stall. Move forward with a documented default assumption, flag the risk in the next review, and set a hard cutoff for revisions. Waiting for perfect inputs is how planning slips into November with nothing approved.
Build capacity models and prep execution in Q4
October and November are where planning turns from discussion into operational choices. This is the period to build the model, test scenarios, and connect the math to hiring, quota setting, and field readiness.
- Build base, upside, and downside models. The base case should reflect your most likely outcome using current productivity, ramp, and conversion assumptions. Upside and downside scenarios should change the key drivers, not just add or remove a flat percentage from revenue.
- Review the scenarios with executive stakeholders. RevOps should walk the model, show where targets break, and call out the exact trade-offs: more hiring, more pipeline, lower quota, or higher risk.
- Lock hiring plans and quota allocation rules. This is where HR and Talent Acquisition matter. A capacity model is only useful if hiring start dates, recruiter bandwidth, and backfill timing are grounded in reality.
- Prepare enablement assets. Managers need territory rationale, quota context, ramp expectations, and KPI definitions before the field kickoff—not after the first forecast call fails.
- Schedule launch events and approvals. SKO, manager training, compensation communication, and dashboard sign-off should already be booked before December.
Most bad capacity plans fail because hiring assumptions were copied from a headcount budget, not validated with Talent Acquisition. If you assume a 30-day fill time and the actual cycle is 75 days plus notice period, your Q2 productive capacity is overstated before the year even starts.
Lock systems and launch the plan by January
The last phase is less about planning and more about execution control. A good plan still fails if Salesforce, dashboards, compensation files, and manager workflows aren’t ready for day one.
- Lock OKRs, quota files, and segment targets so teams aren’t working from draft numbers in January.
- Publish dashboards for pipeline coverage, quota pacing, forecast categories, and hiring progress in Salesforce or your BI layer.
- Run system go-checks in sandbox and production: territory assignments, validation rules, custom object dependencies, automation flows, forecast roll-ups, and permission sets.
- Test data flows for activity sync, opportunity updates, and board-reporting fields so your Q1 reporting doesn’t start with manual workarounds.
- Launch the plan at SKO and manager all-hands with clear KPI ownership, escalation paths, and FAQs.
- Inspect 30/60/90 day checkpoints for adoption, pipeline creation, rep ramp, and hiring progress.
The 30/60/90 checkpoints matter because early adoption failures compound fast. If forecast categories are used inconsistently, stage exit criteria aren’t enforced, or managers ignore the new pipeline inspection cadence in January, you won’t catch the problem until the Q1 miss is already locked in.
Capacity modeling workflow: prevent quota overcommitment
Top-down targets are necessary, but they aren’t a capacity model. When targets are set without role-specific productivity, ramp timing, hiring lag, and attrition, quotas look clean in a board deck and fail on the sales floor.
That failure isn’t just mathematical. Reps know when quotas were built on naive capacity math. It shows up as low CRM adoption, sandbagged commits, rep distrust in leadership, and preventable turnover by mid-year. If people believe the number was never attainable, they stop treating the plan as real.
- Define rep roles and productivity profiles. Separate AE, SDR, AM, CSM, and overlay roles. Then split again by segment if needed. An SMB AE with a 30-day cycle should not share a productivity model with an Enterprise AE carrying seven-figure pipeline over multiple quarters.
- Apply historical ramp curves. Use actual time-to-productivity from Salesforce data, not onboarding goals from enablement slides. For many teams, that means 3-6 months for SMB and Mid-Market roles and 9-12 months for Enterprise.
- Factor in hiring lag and attrition. Add time for recruiter sourcing, interview cycles, accepted offers, notice periods, and onboarding. Then add backfill demand based on expected churn.
- Map capacity to pipeline needs. Convert each role’s quota and win rate into required pipeline by month and by segment. This is where weak assumptions surface fast.
- Derive the headcount plan. Once you know required pipeline and productive capacity by period, you can calculate how many reps you actually need—and when those hires must start.
Keep this model in one place with version control. If Sales uses one spreadsheet, Marketing uses another, and Finance recasts the outputs in its own model, you’ll spend planning meetings arguing about inputs instead of making trade-offs.
Factor hiring lag and attrition into headcount plans
Most annual plans are overcommitted because they assume open roles turn into productive reps almost immediately. They don’t. Even with a strong recruiting team, lead times stack: approval, sourcing, interview process, offer, acceptance, start date, onboarding, then ramp.
Attrition formula: Expected backfills = starting headcount × annual attrition rate.
Productive capacity formula: Planned headcount - unfilled roles - ramp-adjusted new hires - attrition losses = productive headcount.
Example: if you start the year with 50 AEs and model 20% annual attrition, you should expect about 10 backfills over the year. If you need 60 productive AEs by Q3, you don’t hire 10 net-new reps. You need enough hiring volume to cover the 10 expected losses and the 10 net adds, with lead time built in. If average time to fill is 60 days and Enterprise ramp is 9 months, those Q3 needs have to show up in the recruiting plan much earlier than most teams expect.
Validate these assumptions with frontline managers. They know where turnover risk is concentrated, which segments have longer onboarding cycles, and where productivity drops during territory changes.
Map pipeline needs to derive final headcount numbers
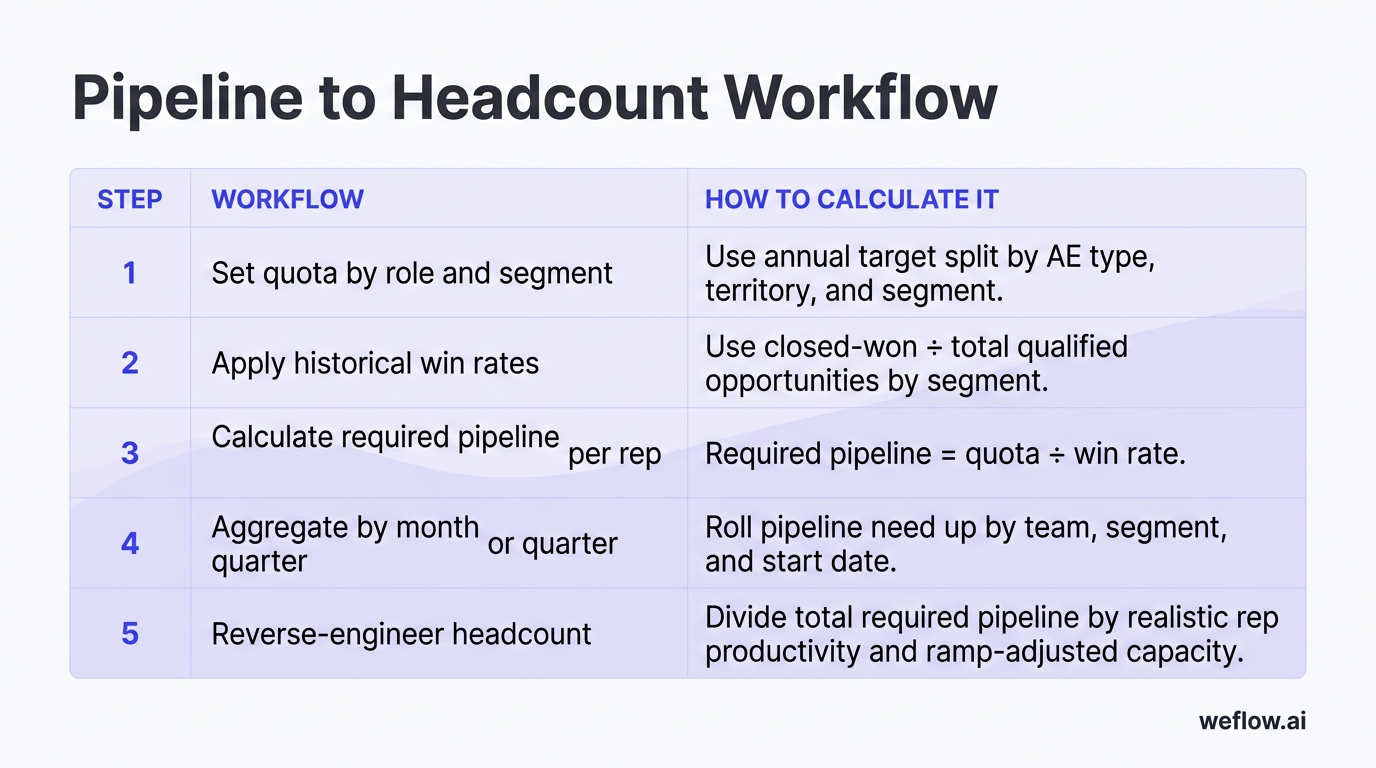
Once you’ve modeled productivity, the next step is to translate revenue targets into required pipeline, then required headcount. This is the part many planning teams skip—they go straight from budget to hiring count. That creates a budget-compliant plan, not a target-attainable one.
| Step | Workflow | How to calculate it |
|---|---|---|
| 1 | Set quota by role and segment | Use annual target split by AE type, territory, and segment |
| 2 | Apply historical win rates | Use closed-won ÷ total qualified opportunities by segment |
| 3 | Calculate required pipeline per rep | Required pipeline = quota ÷ win rate |
| 4 | Aggregate by month or quarter | Roll pipeline need up by team, segment, and start date |
| 5 | Reverse-engineer headcount | Divide total required pipeline by realistic rep productivity and ramp-adjusted capacity |
The key difference here is direction of travel. If you derive headcount from pipeline needs, the model tells you what it takes to hit the number. If you derive headcount from a budget ceiling, the budget tells you what level of miss you’re implicitly accepting. RevOps should make that trade-off explicit.
Pipeline coverage strategy: buffer against market shifts
Pipeline coverage should be modeled, not inherited from a generic rule of thumb. A flat 3x target can be directionally useful, but it becomes dangerous when win rates vary meaningfully across segments, products, or regions.
- Align coverage targets to actual conversion rates. An Enterprise team closing at 25% needs a different coverage ratio than an SMB team closing at 40%.
- Connect Marketing and SDR targets to quota math. Monthly lead volume, meeting conversion, and SQL creation targets should roll up to the pipeline model, not sit in a separate demand gen plan.
- Monitor pipeline health continuously. Build dashboards that show coverage by rep, segment, stage, and quarter, then automate alerts when coverage falls below threshold.
- Remediate gaps based on root cause. If coverage is light because opportunity creation is down, the fix is volume. If volume is fine but win rate is falling, the fix is conversion quality, deal qualification, or sales execution.
- Add a risk buffer. Most teams need a 10-20% pipeline cushion to account for timing slips, conversion volatility, and push risk.
A static 3x rule is usually too high for fast, transactional motions and too low for complex Enterprise sales. If your SMB win rate is 40%, 2.5x coverage may be enough. If your Enterprise win rate is 20-25%, 4x or more may be safer—especially if deals slip across quarter boundaries.
Set coverage ratio targets based on historical win rates
Formula: Required pipeline coverage = quota ÷ win rate, then add a 10-20% risk buffer.
Example: an Enterprise AE carrying a $1M quota with a 25% win rate needs about $4M in qualified pipeline before adding risk buffer. An SMB AE with a $600k quota and a 40% win rate needs about $1.5M, or 2.5x coverage. Same planning model, different operating ratio.
Run this math by segment, not just by team. That’s how you avoid underfunding harder motions and overloading simpler ones.
Develop base, upside, and downside revenue scenarios
Scenario planning keeps the annual plan usable when markets shift, hiring slips, or conversion rates move. The goal isn’t to predict every outcome. It’s to know which drivers matter and what actions each scenario requires.
| Scenario | Core assumptions | What it means operationally |
|---|---|---|
| Base case | Current headcount plan, historical win rates, standard ramp timing, planned marketing support | Most likely operating plan; use it for quotas, budgets, and hiring approvals |
| Upside case | 10-20% improvement in one or more drivers such as win rate, pipeline generation, or ramp speed | Shows where additional budget or faster hiring could produce incremental revenue |
| Downside case | Pipeline shortfalls, slower ramp, delayed hiring, or higher attrition | Defines early warning triggers and where you would cut, rebalance, or reset targets |
When you present this to the board or C-suite, keep the tone operational. Don’t frame downside as panic. Frame it as decision readiness: “If pipeline creation trends 15% below plan by March, here are the cost, hiring, and target implications.” Executives usually respond better to explicit trade-offs than vague confidence.
Reconcile top-down targets with bottom-up capacity
This is the part of planning where RevOps shifts from analyst to facilitator. Your job is to show the gap clearly and force a decision on which driver changes.
- Gather the executive target. Document the ARR, bookings, pipeline, and efficiency expectations from the CEO, CRO, and CFO.
- Run bottom-up validation. Compare that target against productive headcount, realistic ramp, historical win rates, and required pipeline creation.
- Quantify the gap. Show the shortfall by quarter, segment, and driver—headcount, conversion, or pipeline volume.
- Facilitate the reconciliation review. Bring Sales, Marketing, FP&A, and CS into one decision meeting. Don’t let the target and model live in separate conversations.
- Lock the decision. Either approve more investment, lower the target, or accept the risk explicitly.
A useful way for RevOps to push back professionally is to frame the model as a choice architecture: “We can support the board target if we add eight Enterprise AEs by Q2, improve win rate by 3 points, or accept lower attainment. Which path do we want to fund?” That keeps the conversation factual, not political.
Performance audits: use historical data to validate inputs
Annual planning should start with actuals, not opinions. If win rates, ramp curves, and retention assumptions aren’t audited against real CRM data, the model is weak before it reaches Finance.
Gut-feel planning is expensive because the bad assumptions compound. A 5-point miss on win rate affects pipeline coverage, headcount demand, marketing targets, and quota design all at once. That’s why RevOps needs one integrated GTM report tying Sales, Marketing, and CS performance together.
| Audit type | What to review | Data sources |
|---|---|---|
| Sales audit | Bookings by rep and segment, ramp outcomes, pipeline coverage at quarter end, stage conversion, territory variance | Salesforce reports, forecast history, BI dashboards, quota files |
| Marketing audit | Lead volume by source, lead-to-SQL conversion, opportunity creation, campaign efficiency, lead aging by cohort | Marketo, Pardot, Salesforce campaign reports, BI dashboards |
| CS audit | GRR, NRR, renewal timing, expansion motion, support load, usage patterns versus churn | Salesforce, CS platform, billing system, support system |
| Integrated GTM report | Cross-functional KPI trends, assumptions versus actuals, and recommended changes for next year | BI layer, executive deck, planning model, Salesforce source data |
A simple reporting frame works well here: What happened? So what does it mean? Now what changes in next year’s plan? That turns audits into planning inputs instead of historical summaries.
Extract sales and marketing metrics for baseline inputs
Before you export anything, clean the CRM data. Check stage hygiene, close date integrity, ownership changes, duplicate accounts, and whether activity data was captured consistently in Salesforce. If the data is noisy, your ramp and win-rate model will be noisy too.
- Audit rep productivity. Measure ARR or bookings per fully ramped AE by segment, territory, and tenure band.
- Review ramp outcomes. Compare expected ramp months to actual time-to-first-opportunity, first win, and steady-state attainment.
- Compile lead and pipeline metrics. Pull lead volume, source mix, MQL-to-SQL conversion, SQL-to-opportunity conversion, and sourced pipeline by month.
- Run cohort analysis on lead aging. See how conversion changes when leads sit untouched, and where follow-up delays are depressing pipeline creation.
- Validate stage conversion rates. Use actual Salesforce opportunity history, not manager estimates, to set planning assumptions.
Evaluate customer success retention and churn drivers
New business targets are only half the model. If renewal and expansion assumptions are off, Sales ends up carrying a replacement burden that no one planned for.
- Calculate gross and net revenue retention. Break results out by segment, product line, tenure, and CSM coverage model.
- Analyze time-to-renew and expansion timing. Renewal behavior affects when revenue lands, not just whether it lands.
- Compare usage and support metrics to churn. Low adoption, high support ticket volume, or long resolution times often show up before logo loss.
- Identify preventable churn drivers. Feed those patterns back into CS hiring plans, account coverage models, and product escalation paths.
The planning impact is direct. If churn rises by 2 points on a $100M ARR base, that’s $2M more revenue the business must replace before it posts any net growth. Sales then needs more pipeline, more productive capacity, or both.
Compare internal metrics against B2B SaaS benchmarks
Benchmarks help pressure-test assumptions, but they shouldn’t override your own data. A company with larger ACV, longer cycles, or heavier services work will land outside generic ranges for good reasons.
| Metric | Reference range |
|---|---|
| Annual ARR per fully ramped AE | $500k-$1M |
| Win rate | 20%-30% |
| Ramp time: SMB / Mid-Market | 3-6 months |
| Ramp time: Enterprise | 9-12 months |
| Pipeline coverage ratio | 3x-4x, adjusted by segment |
| Quota attainment rate | 70%-80% of reps hitting quota |
Use these as guardrails. If your Enterprise team needs 12 months to ramp because of complex implementation cycles, forcing a 6-month assumption just to match a benchmark will break the model.
Cross-functional workshops: secure executive budget sign-off
Planning works better when the hard conversations happen in the same room. RevOps should act as the neutral facilitator here—keeping the discussion anchored in inputs and outputs, not letting Sales and Marketing point fingers when coverage or conversion assumptions don’t line up.
- Workshop summit: Multi-day working session to align targets, assumptions, and owners across Sales, Marketing, CS, and Finance.
- Driver-tree session: Break revenue into its component drivers—new business, expansion, win rate, pipeline volume, retention, and headcount productivity.
- Breakout sessions: Stress-test assumptions by function and identify risks, mitigation steps, and resourcing needs.
- Executive alignment review: Bring the refined model back to leadership for funding and final sign-off.
Run a workshop summit to finalize the annual plan
A good summit is structured like a working session, not a presentation marathon. The goal is decision-making.
| Day | Focus | Output |
|---|---|---|
| Day 1 | Review plan-versus-actuals and present the driver tree | Shared view of last year’s gaps and current-year target logic |
| Day 2 | Break out by function to validate assumptions | Documented risks, dependencies, and revised planning inputs |
| Day 3 | Reconcile scenarios and funding needs | Preferred base case and explicit trade-off options |
| Day 4 | Assign KPI ownership and review execution readiness | Named owners, deadlines, and reporting cadence |
| Day 5 | Executive review and final decisions | Approved annual GTM plan |
Set ground rules at the start: use audited data, challenge assumptions not people, document disagreements in the model, and leave each session with owners and dates. That keeps the workshop from drifting into opinion-heavy debates.
Align compensation structures with capacity models
Comp design should reflect modeled capacity, not maximum theoretical output. If you set quotas at 100% of peak capacity, most reps will view the plan as punitive from day one.
- Calibrate quotas at 80-90% of modeled capacity. That usually lands closer to a realistic attainability range and supports a healthier 70-80% attainment distribution.
- Define payout curves by motion. New logo, expansion, and renewal motions often need different weightings and thresholds.
- Set accelerator thresholds deliberately. A common approach is accelerators starting at 110% attainment, with a minimum floor before accelerators apply.
- Review total compensation cost with FP&A. The comp plan has to fit the budget scenario you actually approved.
When quotas are pegged to maximum capacity, rep turnover usually follows. People will tolerate a hard target. They won’t stay long under a target that was never built to be hit.
Map capacity and pipeline metrics to FP&A budgets
RevOps and FP&A need to translate the same plan into different units. RevOps talks in drivers—headcount, ramp, win rate, coverage. Finance talks in dollars—OTE, CAC, budget variance, and burn.
- Co-create one planning deck. Use a shared deck or model that connects revenue targets to headcount, pipeline requirements, marketing spend, and compensation cost.
- Translate drivers into financial impact. Show cost per hire, OTE burden, expected CAC by channel, and payback assumptions under each scenario.
- Establish monthly variance monitoring. After approval, review plan versus actual on both operating metrics and financial metrics so budget risk is visible early.
This is where budget gets approved or rejected. If RevOps can’t explain the cost impact of its capacity recommendations, Finance will default to cost control over revenue capacity.
Design sales territories based on account potential
Territory design should happen after capacity modeling, not before. First decide how much productive capacity you need. Then distribute that capacity across the accounts and segments that justify it.
- Segment accounts by ARR potential and ICP fit. Use firmographic and historical conversion data, not just named-account lists.
- Balance workloads with consistent logic. Equal account counts rarely create equal opportunity. Use weighted distribution based on account potential, deal complexity, and motion type.
- Validate against real selling capacity. Check geography, meeting load, travel requirements, and account coverage expectations.
- Review historical territory performance. Use last year’s attainment and pipeline creation patterns to spot under- or over-resourced regions.
Tech stack roadmap: optimize tools for execution readiness
The annual plan only works if the systems can support it. That means more than license count. You need clean ownership, low integration overhead, reliable Salesforce write-back, and enough governance to stop last-minute tool requests from breaking the rollout.
This is also one of the easiest places to find budget. Cutting redundant software or underused seats can free up spend for one more recruiter, one more AE, or another quarter of campaign budget.
| Tech stack area | What to assess | Required action |
|---|---|---|
| Inventory | All GTM systems, owners, licensed seats, primary workflows, Salesforce integration footprint | Build a system inventory with owner, purpose, cost, and renewal date |
| Rationalization | Overlapping tools, low adoption, duplicate reporting, weak Salesforce write-back | Score each tool on usage, ROI, and operational fit; mark decommission candidates |
| Roadmap | Capability gaps for forecasting, activity completeness, enablement, and reporting | Sequence upgrades and rollouts by business priority and implementation effort |
| Governance | How new requests get approved and how old systems get retired | Create a quarterly review process with RevOps, Business Systems, Security, and Finance |
| Execution readiness | Validation rules, dashboard dependencies, forecast fields, custom objects, API usage | Run pre-go-live testing in Salesforce and document rollback steps |
Audit tool adoption and collect frontline feedback
Low adoption doesn’t always mean the software is bad. Often it means the workflow wasn’t embedded, the training was weak, or the system added one more tab without improving data completeness in Salesforce.
- Pull login and feature-use reports. Review adoption by role, team, and manager—not just total licensed users.
- Run quarterly surveys or focus groups. Ask where the workflow breaks, which data is missing, and what creates duplicate entry.
- Build role-based micro-training. Managers, SDRs, AEs, and CSMs usually need different guidance tied to their daily workflow.
- Track adoption lift after training. If usage doesn’t improve, the issue may be workflow fit, not enablement.
Follow the annual planning checklist for final review
Treat the final checklist as a mandatory tollgate before you present the plan to the board or launch it to the field.
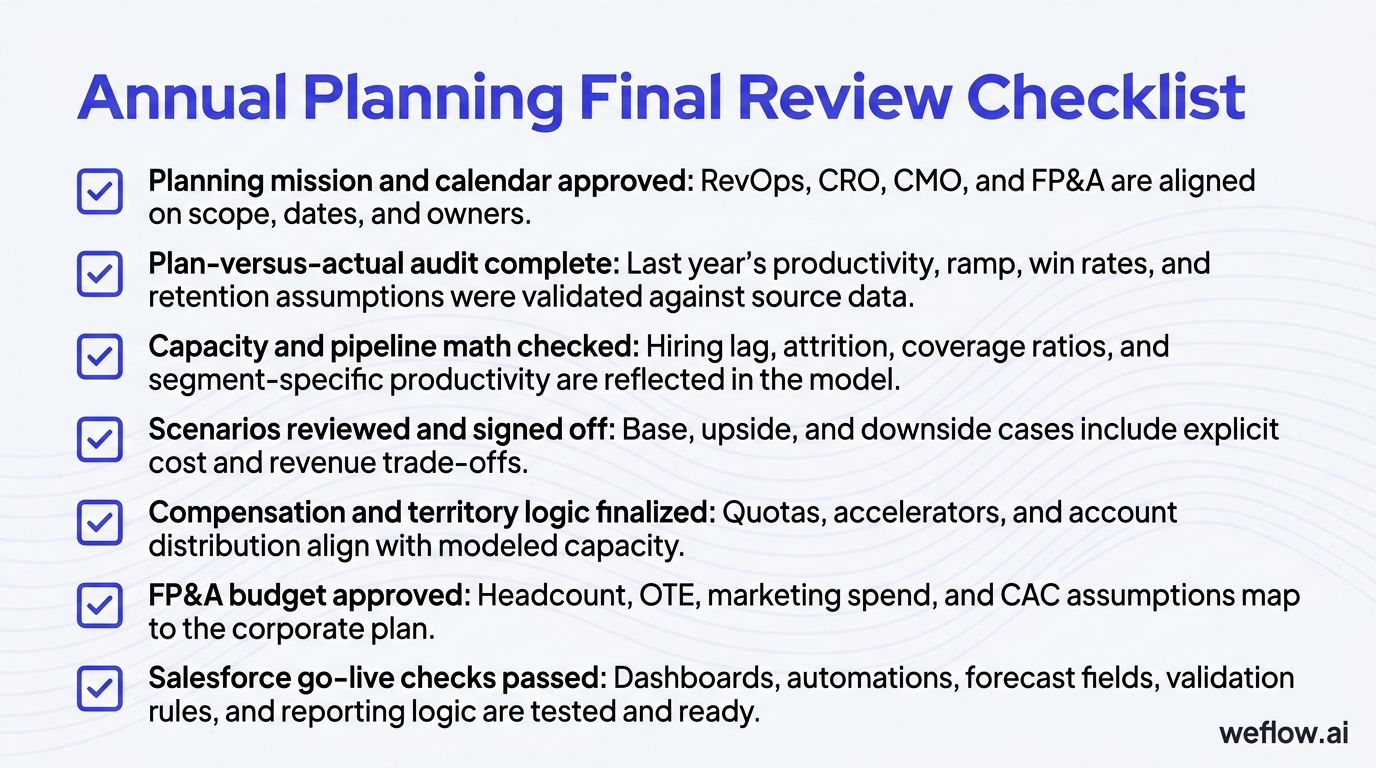
- Planning mission and calendar approved: RevOps, CRO, CMO, and FP&A are aligned on scope, dates, and owners.
- Plan-versus-actual audit complete: Last year’s productivity, ramp, win rates, and retention assumptions were validated against source data.
- Capacity and pipeline math checked: Hiring lag, attrition, coverage ratios, and segment-specific productivity are reflected in the model.
- Scenarios reviewed and signed off: Base, upside, and downside cases include explicit cost and revenue trade-offs.
- Compensation and territory logic finalized: Quotas, accelerators, and account distribution align with modeled capacity.
- FP&A budget approved: Headcount, OTE, marketing spend, and CAC assumptions map to the corporate plan.
- Salesforce go-live checks passed: Dashboards, automations, forecast fields, validation rules, and reporting logic are tested and ready.
Annual GTM planning: turn strategy into operational reality
The shift here is simple: stop guessing, start modeling. When RevOps owns the calendar, audits the inputs, builds realistic capacity models, and forces target reconciliation early, annual planning becomes a repeatable operating process instead of a rushed negotiation.
A plan is only as good as its cross-functional alignment. Use the planning calendar, capacity model spreadsheet, driver-tree deck, and final tollgate checklist to start your August pre-planning phase now—before next year’s number gets locked without the capacity to support it.
FAQ
When should annual GTM planning start?
Start in August or September if you want a January 1 go-live. That gives enough time for post-mortems, scenario modeling, hiring approvals, compensation design, Salesforce testing, and manager enablement before Q1 starts.
Who owns the annual GTM planning process?
RevOps should orchestrate the process because it owns the planning mechanics, source data, and system readiness. The CRO, CMO, Head of CS, and FP&A still own their targets, budgets, and assumptions within that framework.
How do you calculate pipeline coverage ratios?
Start with required pipeline = quota ÷ win rate, then add a 10-20% risk buffer for timing slips and conversion volatility. Calculate coverage by segment, because an Enterprise motion and an SMB motion rarely need the same ratio.
What is a realistic ramp time for new sales reps?
A common range is 3-6 months for SMB and Mid-Market roles and 9-12 months for Enterprise roles. Your actual planning assumption should come from Salesforce cohort data showing time to first win and time to steady-state attainment.
.webp)

.webp)
.webp)

.webp)

.webp)
.webp)
.webp)

.webp)