

30/60/90 Day CRO Plan to Build Revenue Priorities Fast [Framework]
A new CRO doesn’t get a long runway. By the second or third exec meeting, the CEO wants a point of view on pipeline, forecast risk, team gaps, and where growth is getting stuck.
This 30/60/90 day CRO plan gives you a practical roadmap for the first 90 days: how to audit GTM performance, align Sales, Marketing, Customer Success, and RevOps, and move from observation to measurable revenue gains. The goal isn’t to make big promises in week one. It’s to get to a trusted operating model fast.
[banner type="download" url="https://www.weflow.ai/content/free-cro-onboarding-cheat-sheet" text="CRO Onboarding Cheat Sheet" subtitle="Get a 30/60/90-day plan, weekly checklists, and stakeholder meeting framework." button="Get it free"]CRO role fundamentals: align skills with revenue goals
A modern CRO owns more than new logo sales. The role sits across the full revenue engine—pipeline creation, conversion, expansion, retention, forecasting, and board reporting. That’s why the CRO can’t operate like a glorified VP of Sales.
If Sales, Marketing, and Customer Success run on separate definitions, separate data, and separate goals, the CRO becomes a referee instead of a growth leader. The job is to connect those teams to one operating model, one set of priorities, and one revenue story the CEO and board can trust.
Map core responsibilities to growth targets
The CRO’s responsibilities should tie directly to profitable growth, not just bookings volume. In practice, that usually includes:
- Revenue strategy and planning—set growth targets by segment, region, and motion, then translate them into headcount, coverage, and pipeline requirements.
- Pipeline generation and conversion—hold a single view of demand generation, qualification, sales execution, and stage progression.
- Forecasting—build a forecast process that stands up to weekly exec reviews and board scrutiny.
- Customer journey optimization—remove handoff gaps from first touch through onboarding, expansion, and renewal.
- Cross-functional alignment—keep Marketing, Sales, Customer Success, and RevOps working from the same definitions and operating cadence.
- Team design and talent management—hire, develop, and retain leaders and frontline teams against the right capacity model.
- Executive and board reporting—report on bookings, ARR, NRR, churn, forecast confidence, and pipeline coverage with numbers finance can defend.
- Customer-centric culture—make sure pricing, messaging, process design, and post-sale motions reflect real customer outcomes.
Customer journey work has a direct revenue effect. If handoffs between Sales, onboarding, and Customer Success break down, retention suffers—and that shows up fast in NRR.
Assess leadership, business, and technical skills
The CRO role blends executive leadership, commercial judgment, and operating discipline. The table below shows the skill mix most teams expect from a CRO stepping into a mid-market or enterprise B2B organization.
| Leadership | Business | Technical |
|---|---|---|
| Executive presence | Market analysis | Hiring |
| Change management | Financial planning | Data analysis |
| Cross-functional leadership | Risk management | Sales tech stack |
| Strategic thinking and execution | Business strategy | Financial modeling |
| Team building and development | Contract negotiation | Sales methodology |
| Decision-making under uncertainty | Competitive intelligence | Revenue operations systems |
Technical depth matters more than many boards expect. A CRO doesn’t need to be a Salesforce admin, but they do need to understand what sits behind the number: field mapping, pipeline definitions, activity completeness, forecast roll-up logic, and where the CRM data breaks. financial modeling is a good example. It helps the CRO pressure-test whether a hiring plan, pricing change, or segment expansion can actually hit margin and payback targets.
Structure the revenue org for cross-functional alignment
A common high-level structure looks like this:
- CEO
- CPO
- Product
- CRO
- VP, Marketing
- Demand generation
- Content marketing
- Field marketing
- Product marketing
- Partner marketing
- VP, Sales
- Segment sales
- Geographic teams
- Product-based sales teams
- Outbound
- Partnerships
- VP, Customer Success
- Segment CS teams
- Geographic CS teams
- Product-focused CS
- Support
- Renewals and expansion
- VP, RevOps
- Marketing Ops
- Sales Ops
- CS Ops
- Enablement
- Systems
- VP, Marketing
- CFO
- FP&A
- CPO
The CRO and CFO should stay tightly paired, especially on planning and forecast quality. The CRO owns the operating forecast and the actions behind it. The CFO owns financial rigor, scenario planning, and how those numbers flow into board reporting, cash planning, and company targets. If those two functions use different assumptions, forecast meetings turn into reconciliation exercises.
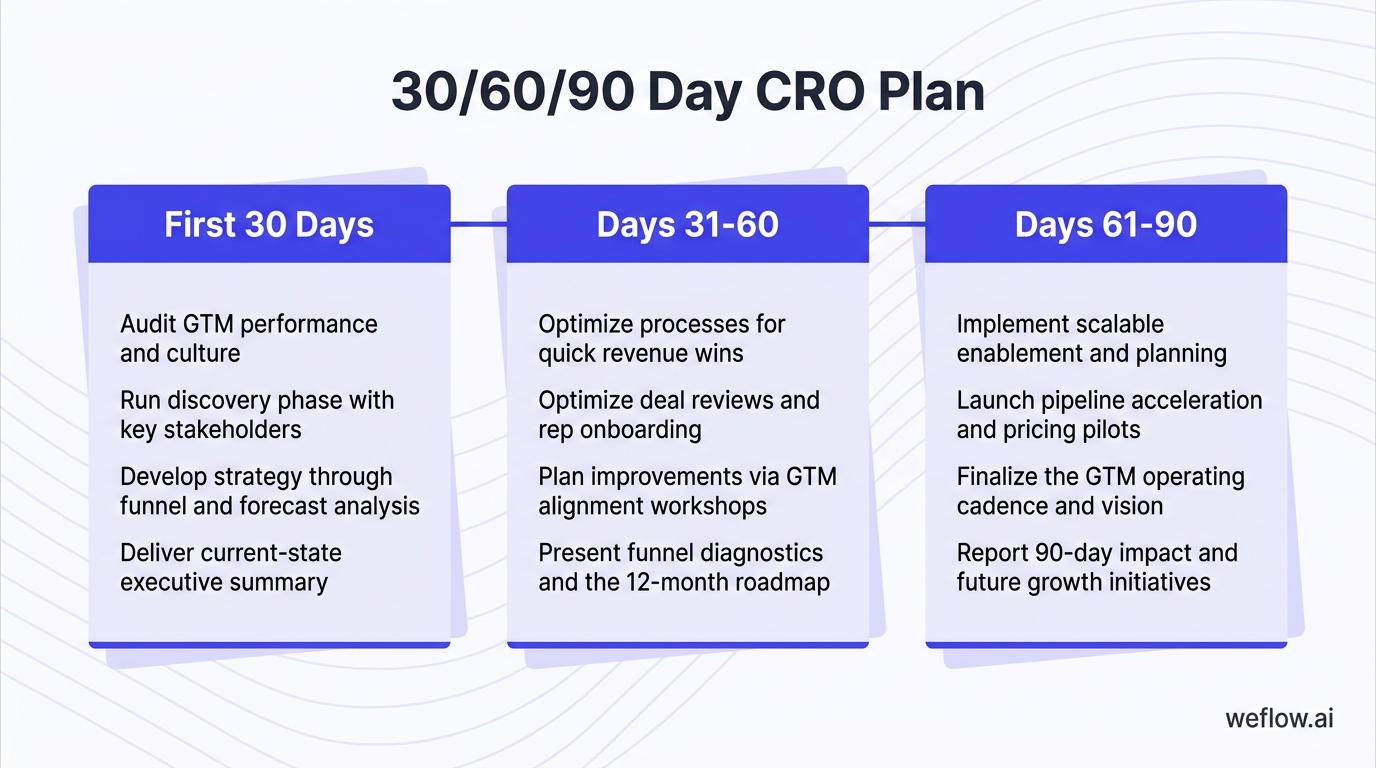
First 30 days: audit GTM performance and culture
The first month is about observation, data gathering, and trust building. A new CRO should listen longer than they talk, shadow real customer interactions, and inspect how the revenue engine works before changing coverage, comp, or process.
This matters because the first diagnosis is often wrong if it’s based only on dashboards. Forecast misses can come from weak discovery, bad qualification, shallow manager inspection, broken Salesforce hygiene, or all four at once.
Run the discovery phase with key stakeholders
Weeks one and two should focus on people, context, and how the company currently tells its revenue story.
| To-do | Example |
|---|---|
| Meet with the executive team and GTM leaders | Run 1:1s with the CEO, VP of Sales, VP of Marketing, Head of Customer Success, CFO, and Head of Product. Ask the VP of Sales, “Where does forecast confidence break down today?” Ask the VP of Marketing, “Which segments convert best after handoff, and where do leads stall?” |
| Review key company assets | Read the latest board deck, annual operating plan, investor memo, and current forecast model before forming an opinion. |
| Shadow sales and customer calls | Join three AE discovery calls, two demo calls, and two CSM QBRs to hear how the company sells, hands off, and expands. |
| Audit revenue KPIs | Pull ARR, NRR, GRR, churn, win rate, and pipeline coverage by segment from RevOps and finance. |
| Assess org structure and culture | Map the GTM org chart, open roles, span of control, leadership gaps, and where decision-making stalls. |
The goal in this phase isn’t to catch people out. It’s to understand how the business actually runs, where teams disagree, and which issues are structural instead of individual.
Develop strategy through funnel and forecast analysis
Weeks three and four shift from listening to analysis. This is where the CRO turns anecdotal input into a working point of view.
| To-do | Example |
|---|---|
| Analyze funnel performance | Build a conversion report from MQL to Closed Won by segment, source, region, and seller cohort. |
| Audit forecast accuracy | Compare the last three quarters of forecast versus actual by rep, manager, and team to find where call accuracy breaks down. |
| Evaluate lead flow and qualification | Review lead scoring, routing logic, SDR scripts, meeting conversion, and acceptance rates between Marketing and Sales. |
| Assess pipeline coverage and health | Calculate coverage ratios by team and inspect aging, stage distribution, slip rates, and concentration risk in large deals. |
| Review CRM hygiene and usage | Pull the percentage of Salesforce opportunities missing close date, next step, amount, forecast category, or recent activity. |
CRM hygiene is often the first hidden roadblock to accurate forecasting. If reps don’t update close dates, if forecast categories aren’t used consistently, or if activity data is incomplete, the pipeline report looks fine until you inspect deal-level data. In Salesforce, even small gaps in required fields or stage discipline can distort commit, best case, and coverage ratios across the quarter.
Deliver the current-state executive summary
By the end of the first 30 days, the CRO should produce a short set of outputs that give the CEO and exec team a shared baseline.
- Current-state GTM summary covering the team structure, funnel shape, product motion, ICP, and major segment differences.
- Stakeholder map showing the GTM org structure, decision owners, and key relationship dynamics.
- Revenue baseline with ARR, NRR, GRR, churn, win rate, forecast error rate, and pipeline coverage.
- Listening tour synthesis with the top five patterns from internal interviews and customer conversations.
- Top three revenue priorities aligned with the CEO and executive team.
Present the listening tour synthesis as pattern recognition, not blame. A useful format is: “Here’s what I heard consistently, here’s what the data supports, and here’s where I think we should focus first.” That keeps the conversation grounded and avoids sounding like a critique of prior leadership after four weeks on the job.
Days 31-60: optimize processes for quick revenue wins
Month two is where the CRO starts changing how the revenue engine works. The focus should stay narrow: fix a few issues that improve conversion, inspection, or forecast quality fast enough for the org to feel the difference.
A real quick win in this phase does more than move a metric. It builds trust. Once teams see that a new forecast cadence, cleaner inspection process, or better segmentation decision produces results, they’ll give the CRO room to make larger changes in quarter two.
Optimize deal reviews and rep onboarding
Weeks five and six should focus on sales execution and where the current system creates drag.
| To-do | Example |
|---|---|
| Run deal reviews across performance tiers | Compare five closed-won and five closed-lost deals to find patterns in discovery quality, multithreading, pricing pressure, and stage progression. |
| Evaluate rep onboarding and ramp | Measure ramp time versus quota attainment for the last five AEs hired and inspect where early-stage conversion falls off. |
| Assess enablement content and adoption | Check usage rates for playbooks, call libraries, battle cards, and manager coaching scorecards. |
| Map the customer lifecycle | Document the handoff from sales to onboarding to QBR to renewal, including ownership, SLAs, and common failure points. |
| Review comp plans for alignment | Test whether AE and CS incentives push the right behavior for deal quality, expansion, and retention. |
Comp plans often create hidden churn risk. If AEs get paid heavily on initial ACV with no quality guardrails, they may push poor-fit deals into onboarding. That fills the funnel in one quarter and raises churn or contraction in the next.
Plan improvements via GTM alignment workshops
Weeks seven and eight should bring the cross-functional team into the same room to agree on segment priorities, messaging, and operating rules.
| To-do | Example |
|---|---|
| Facilitate a GTM alignment workshop | Run a half-day session with Sales, Marketing, Customer Success, RevOps, and finance to review funnel data, handoffs, and segment performance. |
| Update ICP and messaging | Refine ICP definitions by firmographics, buying triggers, pain points, sales cycle, and retention profile. |
| Validate segmentation strategy | Create clear rules for SMB, Mid-Market, and Enterprise coverage, ownership, and service levels. |
| Review forecasting cadence and model | Shift from rep opinion only to a team roll-up supported by stage conversion, pipeline aging, and deal inspection criteria. |
| Communicate listening-tour insights | Send a company recap that explains what was heard, what the data supports, and what changes will happen first. |
Sales and Marketing disagreements usually come down to definitions, not intent. If that tension shows up in the workshop, force the discussion into evidence: conversion by segment, acceptance rates, source quality, and sales cycle data. The team that brings cleaner data usually wins the argument.
Present funnel diagnostics and the 12-month roadmap
By day 60, the CRO should have enough evidence to propose a plan without pretending every assumption is final.
- Funnel diagnostics report with stage-level conversion rates, bottlenecks, slip patterns, and segment differences.
- Forecast model audit covering accuracy issues, cadence gaps, and recommendations for deal inspection and roll-ups.
- Tech and data stack assessment with RevOps input on systems gaps, data completeness, and reporting limitations.
- Performance gap analysis across people, process, and tools.
- Draft 12-month revenue roadmap covering the major bets, sequencing, owners, and expected business impact.
Keep the roadmap in draft form at this stage. The CRO has the clearest early view of the commercial engine, but the final plan still needs input from product, finance, and the leaders who will run the work day to day.
Days 61-90: implement scalable enablement and planning
The final month is where the CRO proves they can do more than diagnose problems. This phase should launch a few targeted initiatives, lock in reporting rhythms, and create a system the company can keep running after the first 90 days.
The shift here is from short-term fixes to repeatable revenue operations. The right outcome is not one heroic quarter. It’s a cleaner pipeline, tighter execution, and a forecast process that improves with each cycle.
Launch pipeline acceleration and pricing pilots
Weeks nine and 10 should focus on immediate pipeline movement and a few testable commercial changes.
| To-do | Example |
|---|---|
| Launch a pipeline acceleration initiative | Identify 10 late-stage at-risk deals, assign exec sponsors, and run targeted outreach with clear next-step ownership. |
| Pilot pricing or packaging changes | Test a land-and-expand offer for the Mid-Market segment and compare conversion, discounting, and expansion potential. |
| Improve demo and sales content | Rewrite the demo narrative around the top three customer pain points surfaced during the listening tour. |
| Roll out micro-training for AEs | Run a 30-minute objection-handling workshop for mid-performers, then inspect behavior change in live deals. |
| Run a targeted pipeline generation campaign | Re-engage aged MQLs and dormant opportunities with segment-specific nurture and SDR follow-up. |
Micro-training works well for mid-performers because it fits into the selling week and focuses on one behavior at a time. Pulling reps off the floor for multi-day bootcamps usually creates short-term coverage loss and weak follow-through.
Finalize the GTM operating cadence and vision
Weeks 11 and 12 should lock the commercial system into place.
| To-do | Example |
|---|---|
| Finalize the GTM operating cadence | Lock biweekly GTM syncs, weekly forecast reviews, and monthly RevOps and performance reviews with clear agendas. |
| Launch live CRO dashboards | Publish dashboards for pipeline, ARR, NRR, churn, coverage, and forecast accuracy, ideally fed from Salesforce and finance-approved definitions. |
| Document the CRO operating model | Write a one-page operating model that lists core meetings, KPIs, decision owners, and escalation paths. |
| Present 90-day impact to executives | Show what changed, which assumptions were confirmed or disproved, and what the next 3-6 months require. |
| Define the next 3-6 month initiatives | Prioritize pricing changes, hiring plans, retention work, system fixes, and segment-specific growth bets. |
A healthy biweekly GTM sync includes the CRO, heads of Sales, Marketing, Customer Success, RevOps, and usually finance. The discussion should stay on shared metrics and cross-functional issues: pipeline creation, conversion, handoff quality, forecast changes, churn risk, and decisions needed before the next cycle. It should not turn into a status meeting for each department.
Report 90-day impact and future growth initiatives
By the end of the first 90 days, the CRO should have a clear set of deliverables that show traction and set up the next phase.
- Finalized GTM operating cadence with meeting structure, dashboard ownership, KPIs, and decision rules.
- Live CRO dashboards with visibility into pipeline, NRR, churn, bookings, and forecast quality.
- 90-day impact summary that shows quick wins, operational changes, and momentum built.
- Updated GTM strategy communication shared with GTM teams and the wider company.
- 3-6 month growth roadmap aligned with the CEO and executive team.
To get company-wide buy-in, communicate the updated GTM strategy in plain terms: what’s changing, why it’s changing, how success will be measured, and which teams own each part. People support operating changes faster when they know how the change affects their decisions, targets, and reporting lines.
GTM strategy matrix: match sales motions to segments
Not every revenue problem is an execution problem. Sometimes the sales motion itself is wrong for the segment. That’s why one of the CRO’s early jobs is to make sure the company’s GTM model matches ACV, sales cycle, implementation burden, and customer buying behavior.
| Strategy | Characteristics | Key components | Investment areas | Success metrics |
|---|---|---|---|---|
| Enterprise | ACV of $100K+; 6+ month sales cycles; multiple stakeholders; high security and compliance scrutiny; higher implementation effort | Enterprise AEs, solutions engineers, executive sponsors, professional services, customer success | Field sales, solutions engineering, enterprise features, security review support, executive relationships | Deal size growth, enterprise logo acquisition, reference customers, professional services revenue |
| Mid-Market | ACV of $25K-$100K; 2-4 month cycles; more standardized packaging; lighter implementation | Inside sales, SDRs, light solutions support, standardized onboarding, scaled customer success | Sales development, product standardization, self-serve resources, automated onboarding, partner support | Sales cycle length, CAC payback, win rate, GRR, NRR, product usage |
| Product-Led Growth | Lower initial ACV; self-serve adoption; rapid time-to-value; expansion potential; usage signal matters more than lead score | Product analytics, growth engineering, sales-assist team, in-product education, usage-based expansion paths | Product experience, onboarding flows, usage analytics, lifecycle messaging, automated expansion | Time to first value, activation rate, expansion revenue, user engagement, conversion from free to paid |
| Partner-Led | Shared economics; indirect distribution; geographic reach; industry specialization; ecosystem influence | Partner program, channel sales, partner enablement, co-marketing, deal registration | Partner portal, channel operations, training, MDF, partner support | Partner-sourced revenue, partner satisfaction, program ROI, channel conflict rate, geographic coverage |
| Hybrid | Multiple motions by segment; flexible pricing and coverage; more operational complexity | Segmented teams, shared RevOps rules, cross-functional coordination, attribution logic, motion-specific playbooks | Systems integration, segmentation rules, analytics, planning, team coordination | Segment performance, blended CAC, motion efficiency, resource allocation, overall growth rate |
Applying an enterprise motion to a mid-market product usually destroys CAC payback. If the product is standardized, the buyer count is low, and implementation is light, a field-heavy, high-touch sales model adds cost without adding enough conversion lift.
Structure enterprise and mid-market sales motions
| Factor | Enterprise | Mid-Market |
|---|---|---|
| Typical ACV | $100K+ | $25K-$100K |
| Sales cycle | 6+ months | 2-4 months |
| Team structure | Field sales, solutions engineering, executive sponsorship | Inside sales, lighter solutions support, scaled onboarding |
| Buying process | Multiple stakeholders, security review, procurement scrutiny | Fewer stakeholders, faster evaluation, lighter procurement |
| Primary success measure | Deal size and strategic logos | CAC payback, win rate, and cycle efficiency |
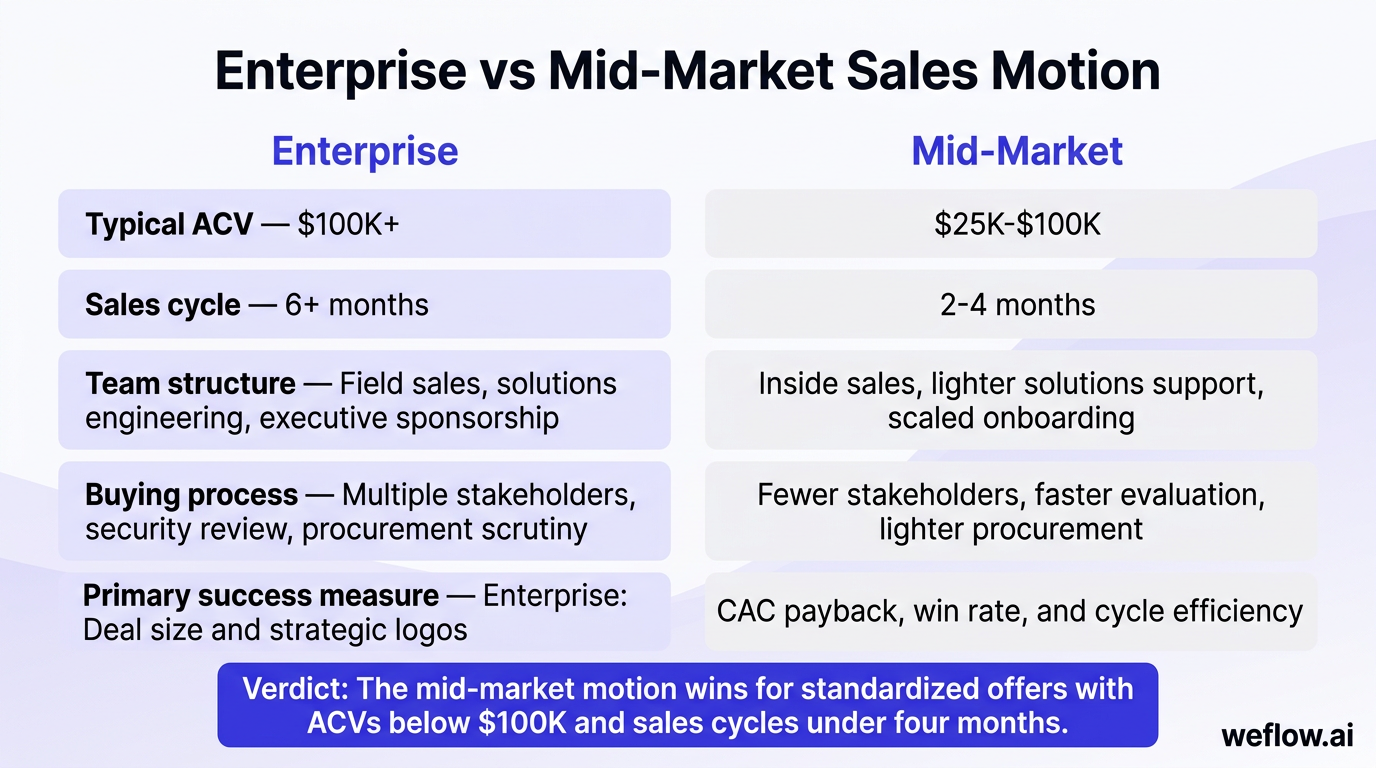
Verdict: The mid-market motion wins for standardized offers with ACVs below $100K and sales cycles under four months.
Moving upmarket is rarely just a pricing change. A mid-market company usually needs stronger security posture, more executive selling, better multithreading, more formal implementation, and a forecast model that can handle fewer but larger deals. Without those changes, the company often gets longer sales cycles without the expected jump in win rates or retention.
Scale product-led and partner-led growth channels
| Factor | Product-led growth | Partner-led |
|---|---|---|
| Main growth driver | Product adoption and expansion | Partner distribution and influence |
| Core buyer path | Self-serve or sales-assist | Channel-led evaluation and sale |
| Key team components | Growth, product, lifecycle marketing, sales-assist | Channel sales, partner marketing, partner success, operations |
| Main investment area | Time to value and in-product conversion | Partner enablement and program economics |
| Primary success measures | Activation rate, expansion revenue, user engagement | Partner-sourced revenue, program ROI, coverage expansion |
Verdict: Product-led growth wins when customers can see value before a sales conversation.
A sales-assist team often bridges the gap in a PLG motion. They step in after product signals show intent—usage depth, invited users, workspace expansion, or admin activity—and help convert and expand accounts without forcing every lead into a traditional sales cycle.
Verdict: Partner-led growth wins when industry access, geographic reach, or implementation credibility matters more than product virality.
Scaling to $100M ARR: fix common pipeline bottlenecks
After the first 90 days, the CRO’s job turns into continuous troubleshooting. Most growth stalls trace back to a short list of recurring problems: weak pipeline coverage, low win rates, slow ramp, poor data quality, rising CAC, and forecast miss patterns that no one fixes at the source.
| Challenge | What it usually means | What to inspect first | Typical fix |
|---|---|---|---|
| Low pipeline coverage | Not enough qualified demand entering the funnel | Source mix, MQL-to-SQO conversion, segment focus | Shift investment to better-converting channels and tighten qualification |
| Low win rates | Weak discovery, poor fit, pricing pressure, or product gaps | Closed-won/lost analysis, objection patterns, competitor losses | Improve discovery, objection handling, and segment targeting |
| Low quota attainment | Rep quality, ramp issues, weak coverage, or poor coaching | Ramp curves, manager inspection, territory design | Fix hiring profile, onboarding, enablement, and coverage design |
| High CAC payback | Acquisition cost is out of line with revenue yield | Channel spend, sales cycle, conversion efficiency | Cut expensive channels, improve conversion, and reset incentives |
| High rep turnover | Poor hiring fit, weak management, or unrealistic territories | Rep profile, manager quality, ramp data, pipeline distribution | Refine hiring process and fix territory and coaching gaps |
| Inconsistent deal quality | Qualification criteria aren’t enforced | Entry and exit criteria by stage, inspection discipline, Salesforce data completeness | Automate data capture, enforce qualification, and inspect deals weekly |
| Lengthy sales cycles | Weak urgency, poor multithreading, or unclear business case | Stage aging, stakeholder mapping, next-step discipline | Improve pain discovery and tie delay to business impact |
| Inaccurate forecasting | Bad data, weak inspection, or inconsistent methodology | Forecast category usage, slip rates, close-date hygiene, manager cadence | Run weekly cadence and combine rep judgment with data-based models |
| Weak PMF in new segments | The company expanded before proving repeatability | VOC, retention, win rate, implementation friction | Run discovery and pilots before scaling headcount |
Correct low win rates and pipeline coverage gaps
- Reallocate budget toward channels and segments that produce higher SQO quality, not just more lead volume.
- Inspect MQL-to-SQO and SQO-to-Closed-Won conversion by segment so Marketing and Sales work from the same quality benchmark.
- Improve discovery quality with tighter call frameworks, manager review, and clear exit criteria by stage.
- Train reps to connect customer pain to negative business impact, not just feature fit.
- Use deal inspection to force urgency: agreed next step, named buying process, and close-date proof in Salesforce.
If win rates are soft, go back to the week five enablement audit. You’ll usually find one of three issues: reps aren’t using the sales process, managers aren’t coaching to it, or the process itself doesn’t match the segment.
Reduce CAC payback and high rep turnover
- Break CAC into channel, headcount, program spend, and cycle length so the team knows which driver is pushing payback out.
- Reset incentives if compensation over-rewards volume and under-rewards fit, retention, or expansion.
- Define the ideal rep profile based on data from top performers, not manager preference.
- Use structured hiring and onboarding to reduce variance in ramp time.
- Invest in manager coaching and clear performance management instead of carrying low performers for too long.
High rep turnover often correlates with poor pipeline visibility. If territories are thin, lead quality is uneven, or opportunity data in Salesforce is unreliable, reps lose confidence in their book and managers struggle to coach. That usually becomes an attrition problem before it shows up as a planning problem.
Revenue metrics: track financial and operational health
The CRO’s scorecard has to work for the board, the CEO, and the teams running the quarter. That means tracking investor metrics, financial metrics, pipeline metrics, and operating metrics in one place, with definitions finance and RevOps both support.
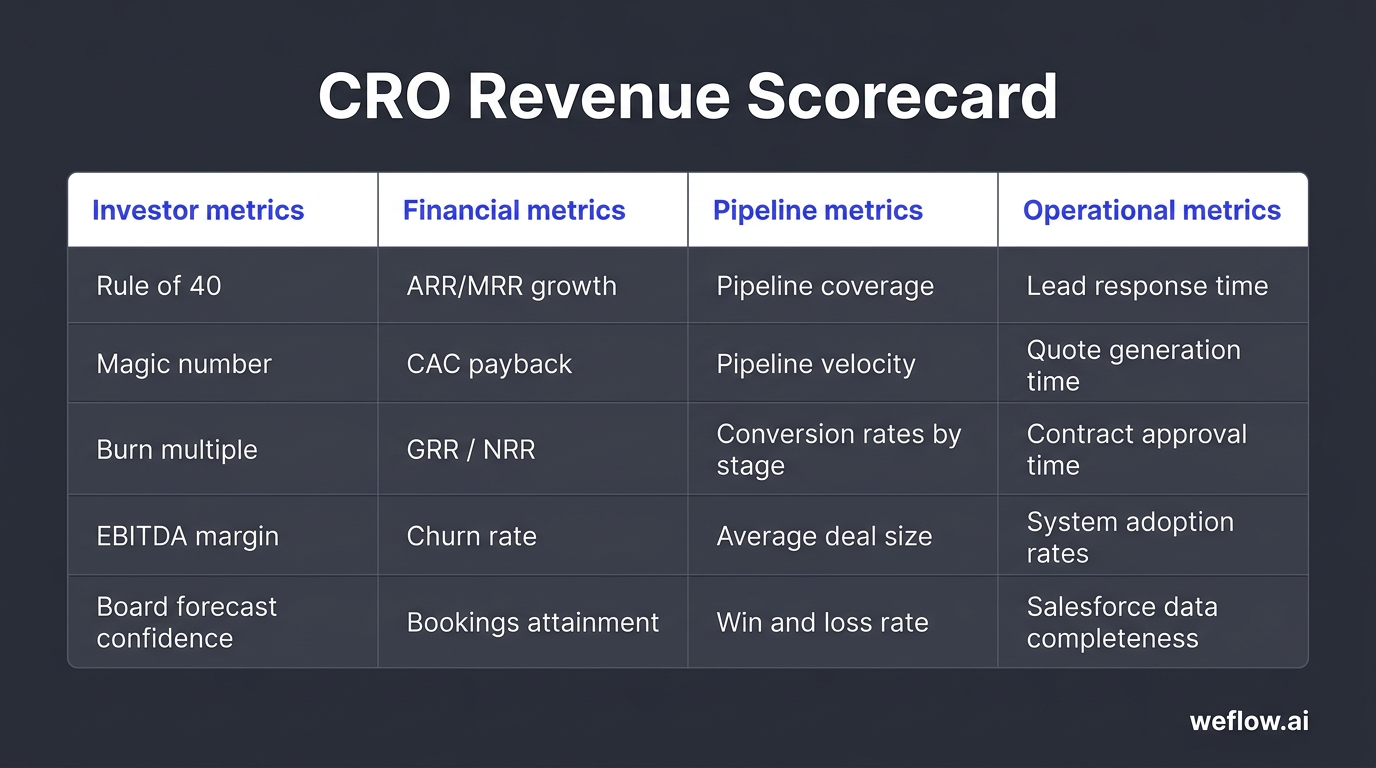
| Investor metrics | Financial metrics | Pipeline metrics | Operational metrics |
|---|---|---|---|
| Rule of 40 | ARR/MRR growth | Pipeline coverage | Lead response time |
| Magic number | CAC payback | Pipeline velocity | Quote generation time |
| Burn multiple | GRR / NRR | Conversion rates by stage | Contract approval time |
| EBITDA margin | Churn rate | Average deal size | System adoption rates |
| Board forecast confidence | Bookings attainment | Win and loss rate | Salesforce data completeness |
These metrics should sit inside the live CRO dashboard established in weeks 11 and 12. If the dashboard only shows pipeline and bookings, the CRO misses the operating inputs that explain why the number moved.
FAQ
What are the top priorities for a new CRO?
The top priorities are to establish a fact-based baseline, align the executive team on the top three revenue issues, and put a repeatable operating cadence in place. In practice, that means auditing funnel conversion, forecast accuracy, segment performance, retention trends, and Salesforce data quality in the first month, then using those findings to drive a clear 12-month revenue agenda.
How should a CRO structure the revenue organization?
The cleanest model puts Marketing, Sales, Customer Success, and RevOps under the CRO so one leader owns pipeline creation, conversion, retention, and reporting. That structure works best when RevOps also controls common definitions, Salesforce governance, dashboard logic, and handoff rules across the customer lifecycle.
Which metrics indicate successful GTM alignment?
The best signals cross departmental lines. Watch CAC payback, NRR, MQL-to-Closed-Won conversion, pipeline coverage by segment, forecast accuracy, and stage-to-stage conversion. If those metrics improve together, the teams are aligned. If one improves while another breaks, the company is usually shifting the problem from one function to another.
How do you fix lengthy B2B sales cycles?
Start by identifying where deals age: discovery, business case, security review, procurement, or legal. Then fix the reason for delay. Most long cycles come from weak pain discovery, poor multithreading, unclear next steps, or no quantified cost of inaction. The fastest path is to make reps prove business impact earlier, inspect close-date changes weekly, and require clear buying-process evidence in the opportunity record.
-p-1600.png)

-p-1600.png)
-p-1600.png)

-p-1600.png)
-p-1600.png)
-p-1600.png)
-p-1600.png)
-p-1600.png)
-p-1600.png)
-p-1600.png)