How to Create an Effective Sales Report
Creating sales reports regularly is crucial for understanding a business’ sales activities. In this guide, we’ll give you a step-by-step approach to creating an effective sales report.
What is a sales report?
A sales report is a document providing an overview of a company's sales activities and their impact over a specific timeframe.
The report may include data on the amount and value of sales, the number of leads and new customers, customer acquisition costs (CAC), and other metrics that help evaluate sales performance.
This data should help businesses make informed decisions on improving their sales strategies and optimizing internal processes and operations.
Sales reporting challenges
Sales reporting, while highly useful, isn’t without its challenges. Here are some of the biggest challenges you might run into when trying to create a sales report:
Inaccurate data
One of the biggest sales reporting challenges is accessing accurate and complete data.
A lot of CRMs are filled with inaccurate and incomplete sales data and records. This happens for a number of different reasons, with the most common one being the lack of sales process adherence from sales reps.
If not addressed, this can result in inaccurate reporting and may lead to bad strategic decisions.
Data collection
Collecting data from multiple sources and syncing it manually is a time-consuming and error-prone process.
To overcome this challenge, sales teams need to automate data collection processes and use data integration tools to combine data from different systems.
Too much data
Sales reports quickly become overwhelming if they include too much data. It happens when a sales team has no clear, measurable goals and fails to define meaningful performance metrics.
You need to specify key performance indicators (KPIs) that are most important to you before you set up tracking — this way, you’ll limit the amount of data included in your reports.
Data analysis
Analyzing sales data involves processing a wealth of information to reveal patterns and trends. It clearly takes analytical thinking.
Furthermore, a person involved in sales analytics should have a deep understanding of your overall business strategy, which allows them to see the bigger picture and avoid decisions that only make an impact in the short term.
Luckily, you can overcome all these challenges by implementing a solid sales tracking and reporting system.
The importance of sales reporting
Accurate sales reporting is critical to organizations of all sizes because it:
- Aids decision-making – You should turn to data before making any decisions — from adjusting your sales activities to allocating your budget. Sales reports provide you with data organized in a way to help you make sense of it effortlessly and use the findings to make informed decisions.
- Helps uncover performance issues – You’ll use sales reports to detect performance issues within your sales team and internal processes. You can even set up rules to automatically spot sales performance issues and receive timely alerts when your sales process is out of control.
- Get valuable insights for sales forecasting – By using the historical data from your sales reports, your sales automation software can create accurate sales predictions. These sales forecasts will allow you to avoid similar mistakes in the future, allocate budgets more accurately, and set more realistic goals for your team.
- Improves cross-functional collaboration – When seeing sales reports, other teams better understand how their activities impact sales performance and vice versa. It helps different teams and departments streamline their efforts to work toward shared goals.
- Keep stakeholders informed – Sales reporting fosters trust and transparency with your stakeholders, ensuring everyone in your organization (and outside it) stays on the same page.
Types of sales reports
There’s no one right sales report for every use case. You’ll be using different types of reports depending on what you want to find out in your sales data and who you want to show it to.
Here are a few common types of sales reports:
- Sales pipeline report – This report helps you evaluate the sales health of your company by tracking the state of your pipeline. It provides an overview of all your current deals in each stage of the sales process, helping to forecast future sales revenue and identify potential bottlenecks in the sales process.
- Conversion report – With this report, you can get insight into how well your sales team converts leads into paying customers. It lets you see where your leads are dropping off, what marketing and sales activities result in higher conversion rates, and what kind of opportunities are most likely to turn into sales.
- Average deal size report – This report shows the average value of each deal, helping businesses understand how much revenue they can expect to generate from different customer personas. It also helps identify which products or services are driving the most revenue.
- Average cycle length report – You can use this report to calculate the time it takes for an opportunity to move through the sales pipeline, from initial contact to close. You should be able to filter your report data by month (e.g., to spot seasonal trends), sales manager, and the stage of the sales process.
- Won and lost deals report – This report provides an overview of your closed deals and lost opportunities so that you can identify the most successful cases and replicate them to win more deals. It usually displays the number of total losses over a given period, the percentage of losses against wins, and the monetary value of those losses. It may also show where exactly losses happen in the pipeline and who is responsible for each loss.
- Sales calls report – This report helps you track the number of sales calls made by each salesperson, the duration of calls, and the outcome of each call. It identifies sales representatives that close the highest number of deals by phone so that you can implement the best practices of your top performers across the team and improve weaker performers.
- Customer churn report – The effectiveness of your sales process isn’t all about the number of closed deals — customer retention and churn rates also indicate the health of your sales strategy. The customer churn report displays the number of customers who have canceled or not renewed their contracts with the business, helping you determine whether you’re selling to the right people or not.
How to create an effective sales report
Creating great sales reports requires some preparation. But with good software at hand and a clear ‘why’ behind each report, you can finally start enjoying the process (and the outcome).
Follow these steps to create an effective sales report:
1. Decide on the purpose of your sales report
Start by thinking about what you’d like to accomplish by creating a sales report.
You need to define a clear objective behind every sales analysis report — be it a quarterly performance review or a weekly sales activity report. This will help you choose the metrics to include in your report and draw meaningful conclusions from it.
First, determine the specific business goals that the sales report will support. This may include increasing revenue, improving sales productivity, or expanding market share.
Next, select the key metrics that help you measure those goals. For example, if the goal is to increase revenue, your KPIs might be the average deal size, conversion rate, and customer lifetime value.
2. Define the audience for your report
The next step is to define who you’re creating the report for. This way, you’ll choose the right report type and tailor its content in a way to answer your audience’s questions.
If the report is intended for executives, for example, it may include an overview of the overall sales pipeline and a revenue forecast.
3. Choose a reporting period
When you have the goal and audience in mind, it’s easier to select a sales period you’ll be analyzing in your report. Typically, sales reports target a specific week, month, or quarter:
- A weekly sales report is useful for keeping a close eye on sales performance on a short-term basis. It typically includes metrics such as the number of sales calls made, the number of deals closed, and the revenue generated during the week. Weekly sales reports help sales teams gauge processes and make quick adjustments to their sales strategies before monthly reports arrive.
- A monthly sales report provides a broader view of sales performance over a longer period of time. It typically includes metrics such as monthly sales revenue, sales conversion rates, and sales funnel analysis. Monthly sales reports help sales teams identify areas of strength and weakness in their sales process and make strategic adjustments.
- A quarterly sales report is used to watch long-term trends and make informed resource allocation decisions. It typically includes metrics such as quarterly revenue, quarterly sales growth, and customer acquisition rates. They’re the perfect place to check whether you’re making it to your annual recurring revenue (ARR) goal, and what you should do if you aren’t.
4. Compile your sales data
At this point, you’ll need to compile all your sales data from your CRM and other relevant systems.
In some cases, you might need to clean up your data or remove duplicate records to ensure that you’re able to create an accurate report.
5. Create your report
The next step is to actually create your report. How you’re going to do this will depend on which CRM solution you’re using and what kind of tools are available to you.
If your company uses Salesforce as its CRM of choice, you can simplify the process of creating sales reports by using Weflow.
In Weflow, you can create a custom pipeline view that shows you exactly the information you need to create a report. Here’s how to do it:
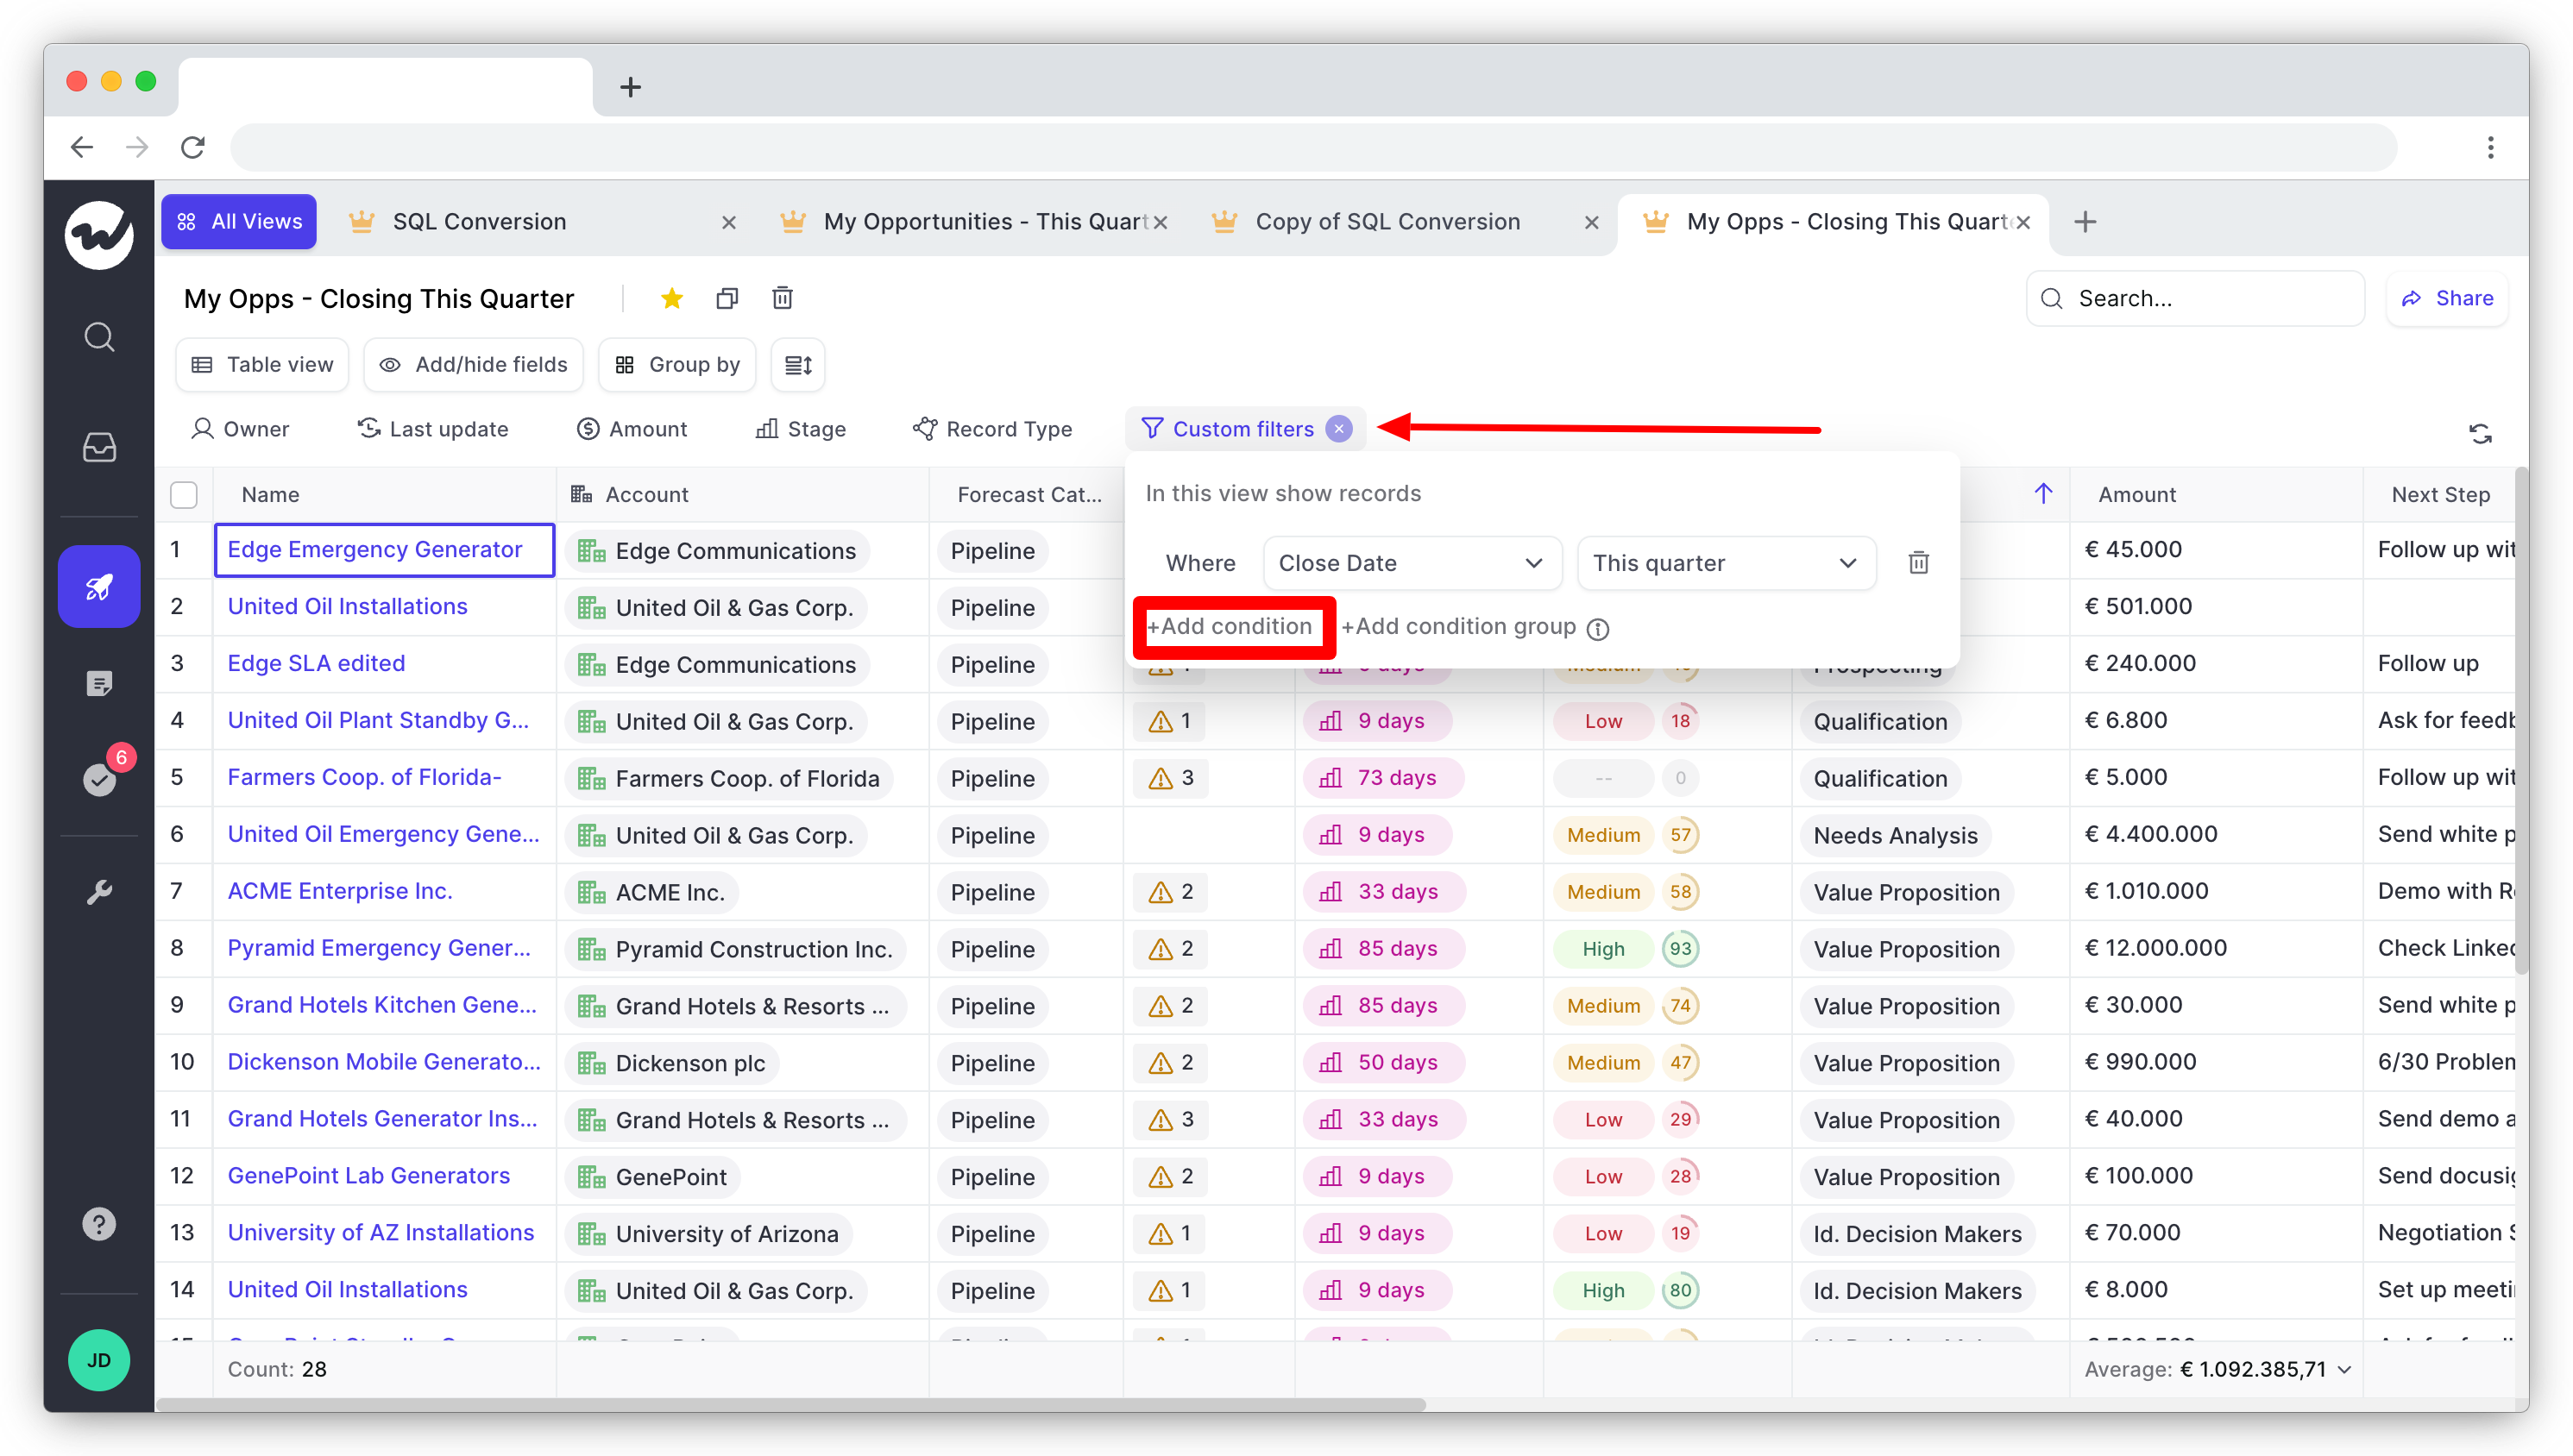
First, log in to your Weflow account and then click on Pipeline in the left-hand menu. From there, click on All views, and then on +Add new view.
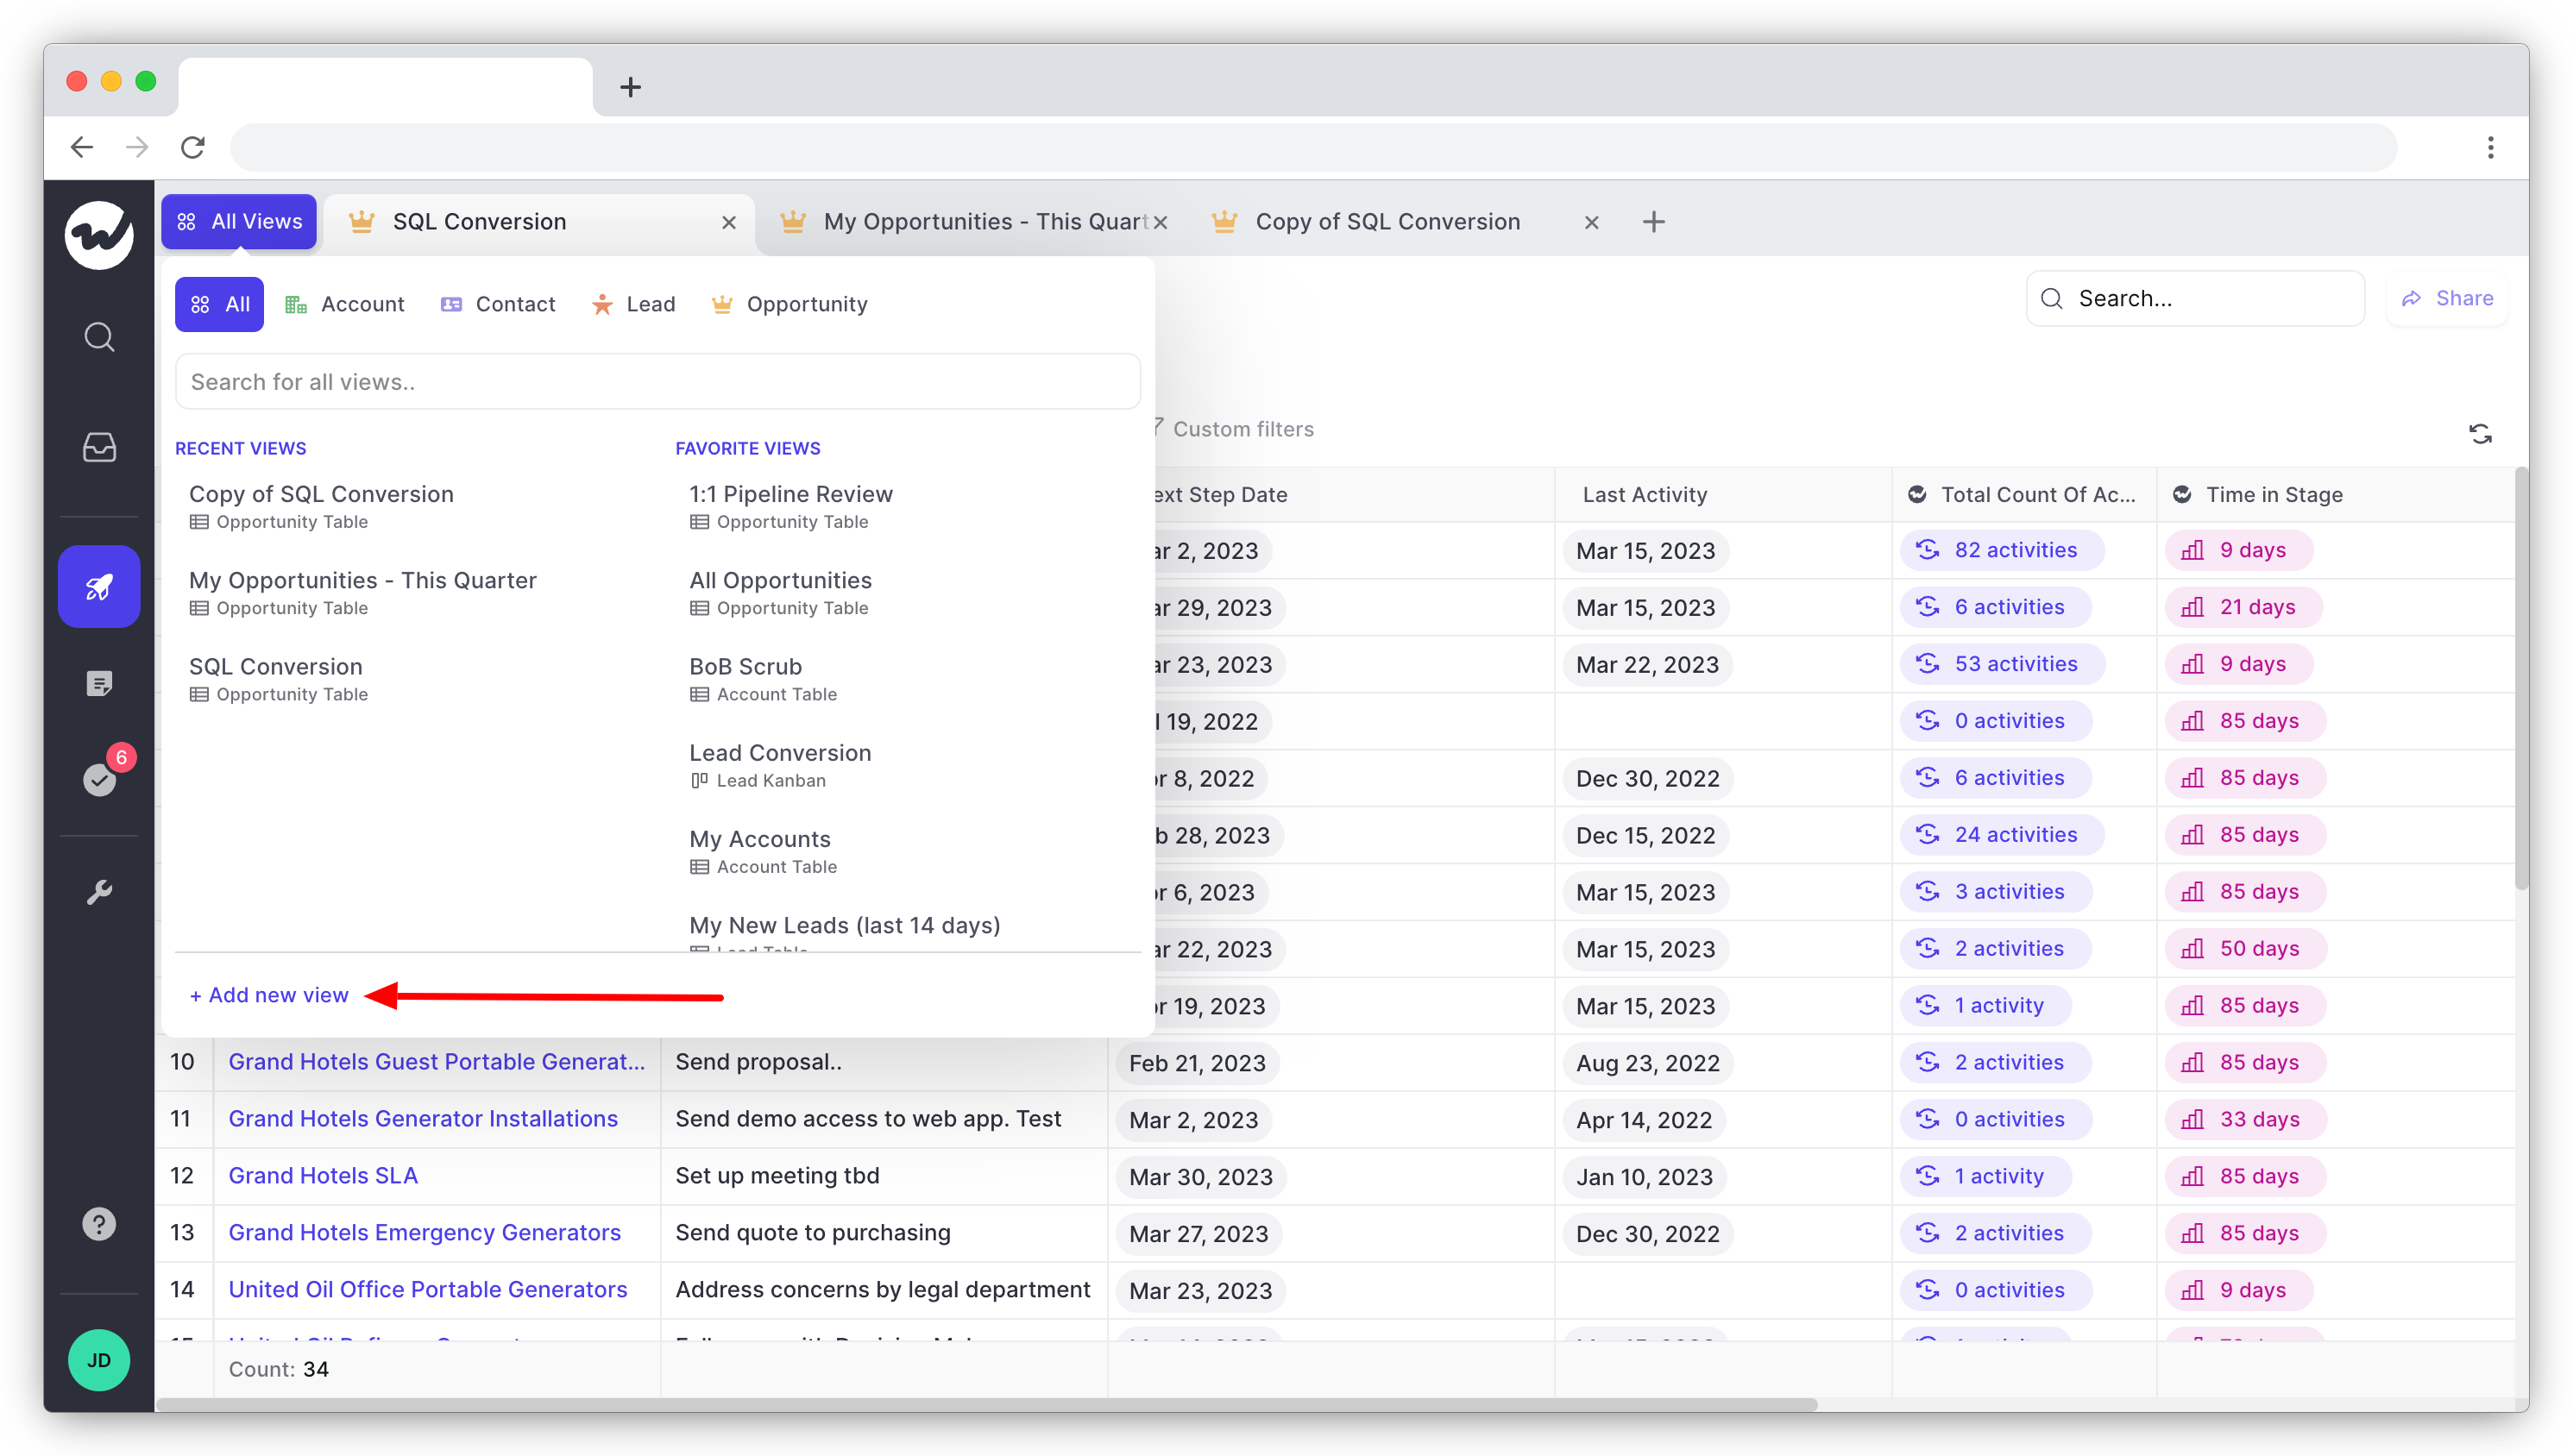
Choose a layout for your view (table or Kanban), add a name, and choose a record type (account, contact, lead, or opportunity).

Weflow will then generate a pipeline view using data from your CRM. You can further customize the view by adding or hiding fields (by clicking the Add/hide fields button) or by using custom filters (click on Custom filters and then add a condition).
6. Explain what the numbers mean
Once your data is organized and cleaned, you can begin analyzing it to draw conclusions. This step involves identifying trends, comparing performance over time, or analyzing performance by product, region, or sales rep.
You also need to explain what the numbers in the report mean if you show the report to someone outside your team. You should be able to provide context and interpret the data to help the target audience understand the significance of the data.
For example, you can add targets or benchmarks in your quarterly reports to compare the real results against — this will help stakeholders understand the meaning behind the numbers in your reports.
Create sales reports that you can act on
Creating a nice-looking sales report isn’t your ultimate goal. The purpose of any sales performance report is to take action on the data it uncovers.
From gathering and analyzing data to presenting it in a way that's easy to understand and actionable — the sales reporting process isn’t that complicated when you know the ‘why’ behind it.