5 Types of Reports in Salesforce and How to Use Them
What are the different types of reports in Salesforce, and which one is the best for your needs? Read this guide to find out.
1. Tabular reports
A tabular report is a spreadsheet-like, basic report format. It takes a few clicks to create reports like this one, and it gives you a comprehensive view of all the records at a certain level (e.g., Accounts, Opportunities, Leads, etc.).
Fields in tabular reports are ordered in columns, with matching records listed in rows. You can customize tabular reports by applying filters or configuring the outline.
However, if you want to group records or create charts, you’ll need to use a completely different report format. Tabular reports have no visualization or data grouping capabilities.
You should use a tabular Salesforce report when you want to:
- Access your records fast.
- Update multiple records.
- Quickly export and share the data outside of Salesforce.
How to create a tabular report in Salesforce
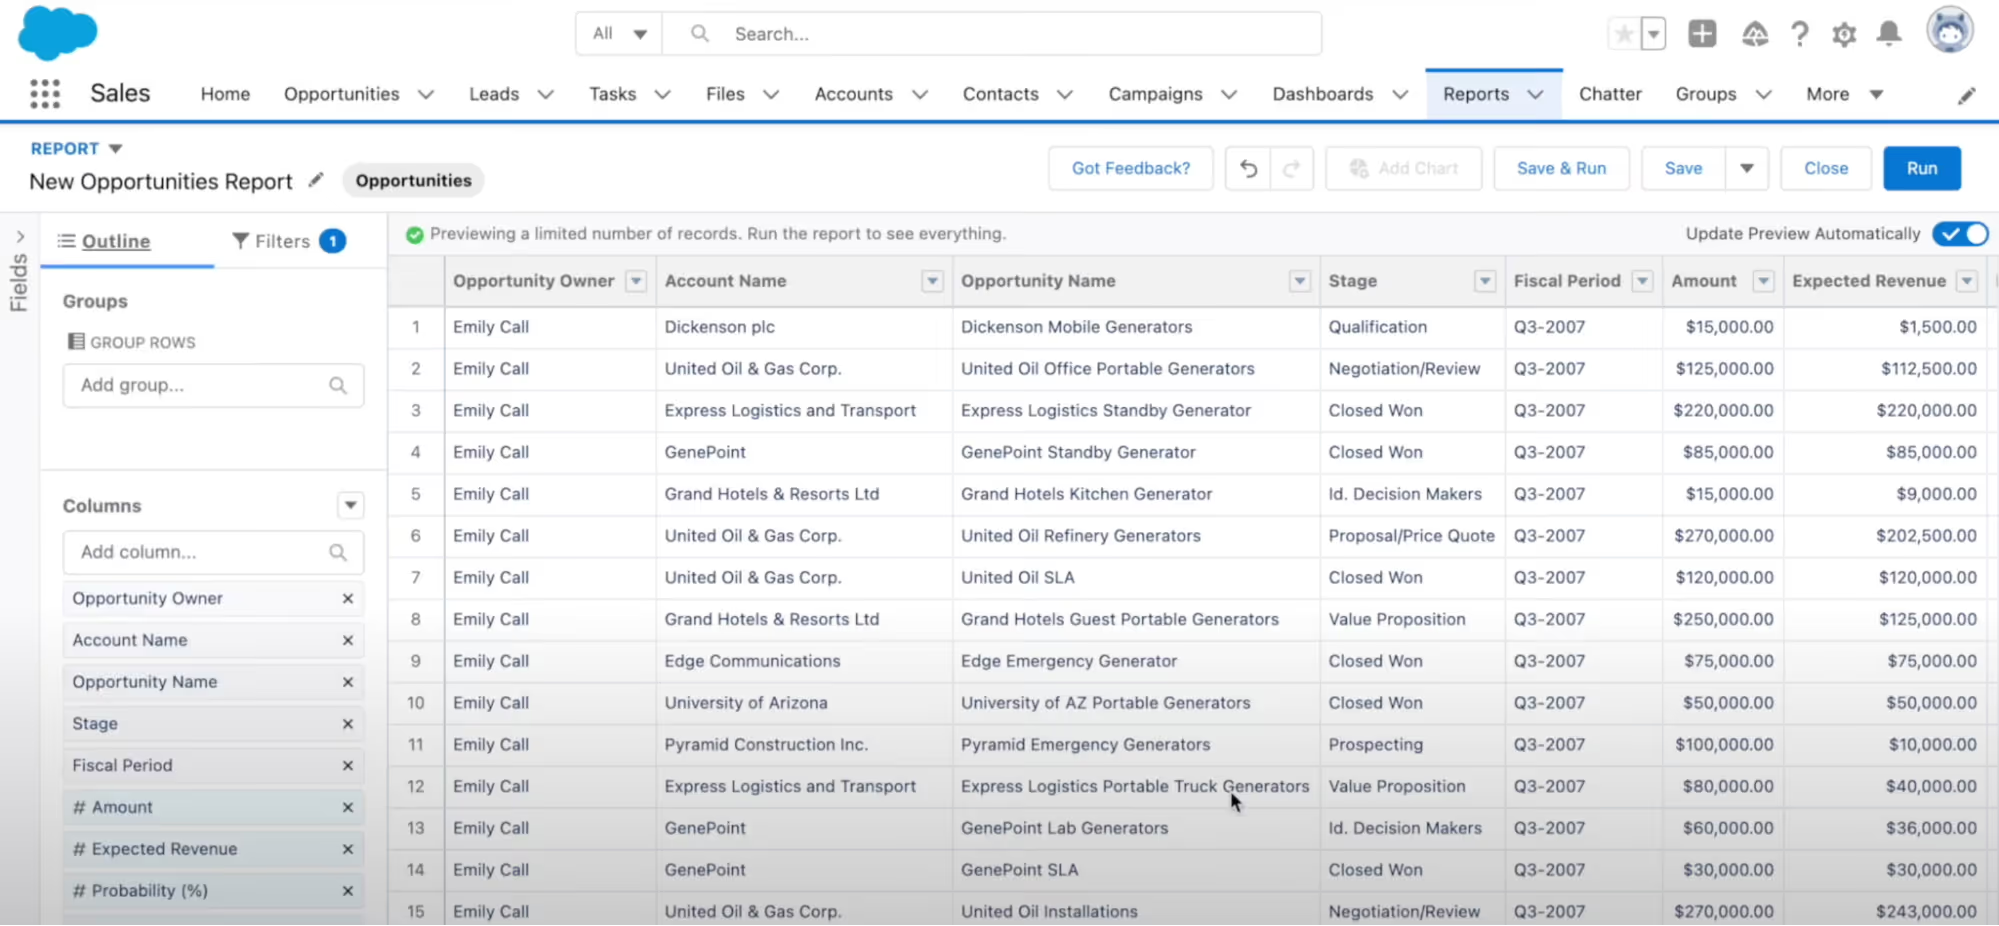
To create a tabular report in Salesforce, go to the Reports tab and create a new report from there.
Choose the report type that will define which fields will appear in your report. For example, if you choose Opportunities, you’ll see a list of opportunities in your pipeline with relevant information displayed in the columns (e.g., opportunity owner, account name, stage, expected revenue, etc.).
Apply filters to narrow down or expand the set of information that you’ll be working with.
In the Outline tab (next to Filters), you can also remove any columns you don’t need.
When you’re done with customization, your tabular report is ready! Don’t forget to save it.
2. Summary reports
A summary report is similar to a tabular report, but it also provides you with the option to group data and create charts.
You should use summary reports when you want to:
- Analyze data by a specific field.
- Get a quick summary of key metrics.
- Compare data across different record groups.
- Analyze data by time period.
How to create a summary report in Salesforce
Building a summary report is similar to building a tabular one, but with a few additional steps:
Start by following the steps for initiating and customizing a new report listed in the tabular report section above.
Choose an individual field (it should include numerical values) and click on Summarize in the drop-down menu.
Select an action from the four options: Sum, Average, Max, and Min.
The result will be displayed at the bottom of the list.
You can also group your records and view subtotals in summary reports:
In the Outline tab, choose Group Rows and group your rows by shared characteristics.
When you summarize the data, the action will also be applied at the group level so that you can see the total per group, the average per group, and the maximum or minimum value per group (depending on the action you’ve specified).
3. Matrix reports
A matrix report allows you to lay out the data in multiple dimensions. In simple terms, it’s a summary report that can also be grouped by both rows and columns.
This is the most complex type of report you can create in Salesforce, commonly used for comparing related totals.
You should use matrix reports when you want to:
- Analyze data across multiple dimensions (e.g., the total number of sales per sales rep over time).
- Create heavily customized reports.
How to create a matrix report in Salesforce
Create a new report and customize it by configuring the outline and applying filters.
Go to the Outline tab and group rows first (1).
Then, group columns in the field below (2).
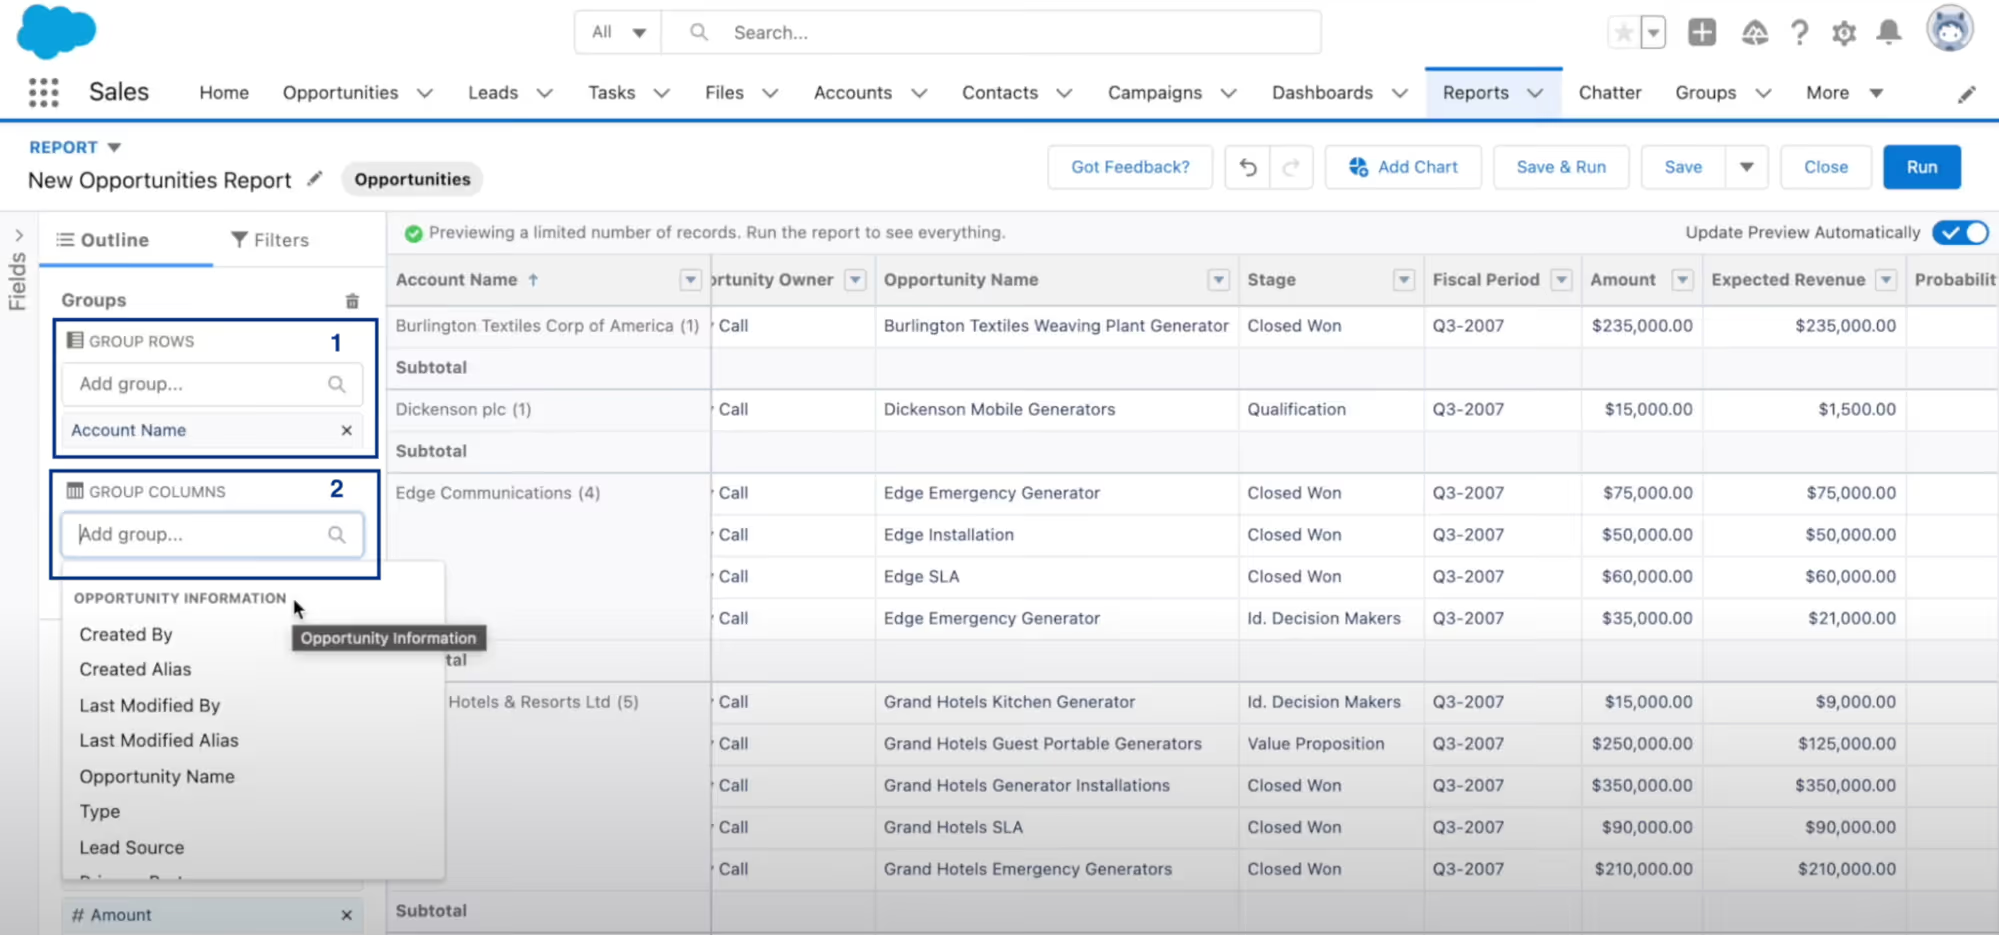
When you’re done, you’ll see the matrix report with the data summarized in a grid format.
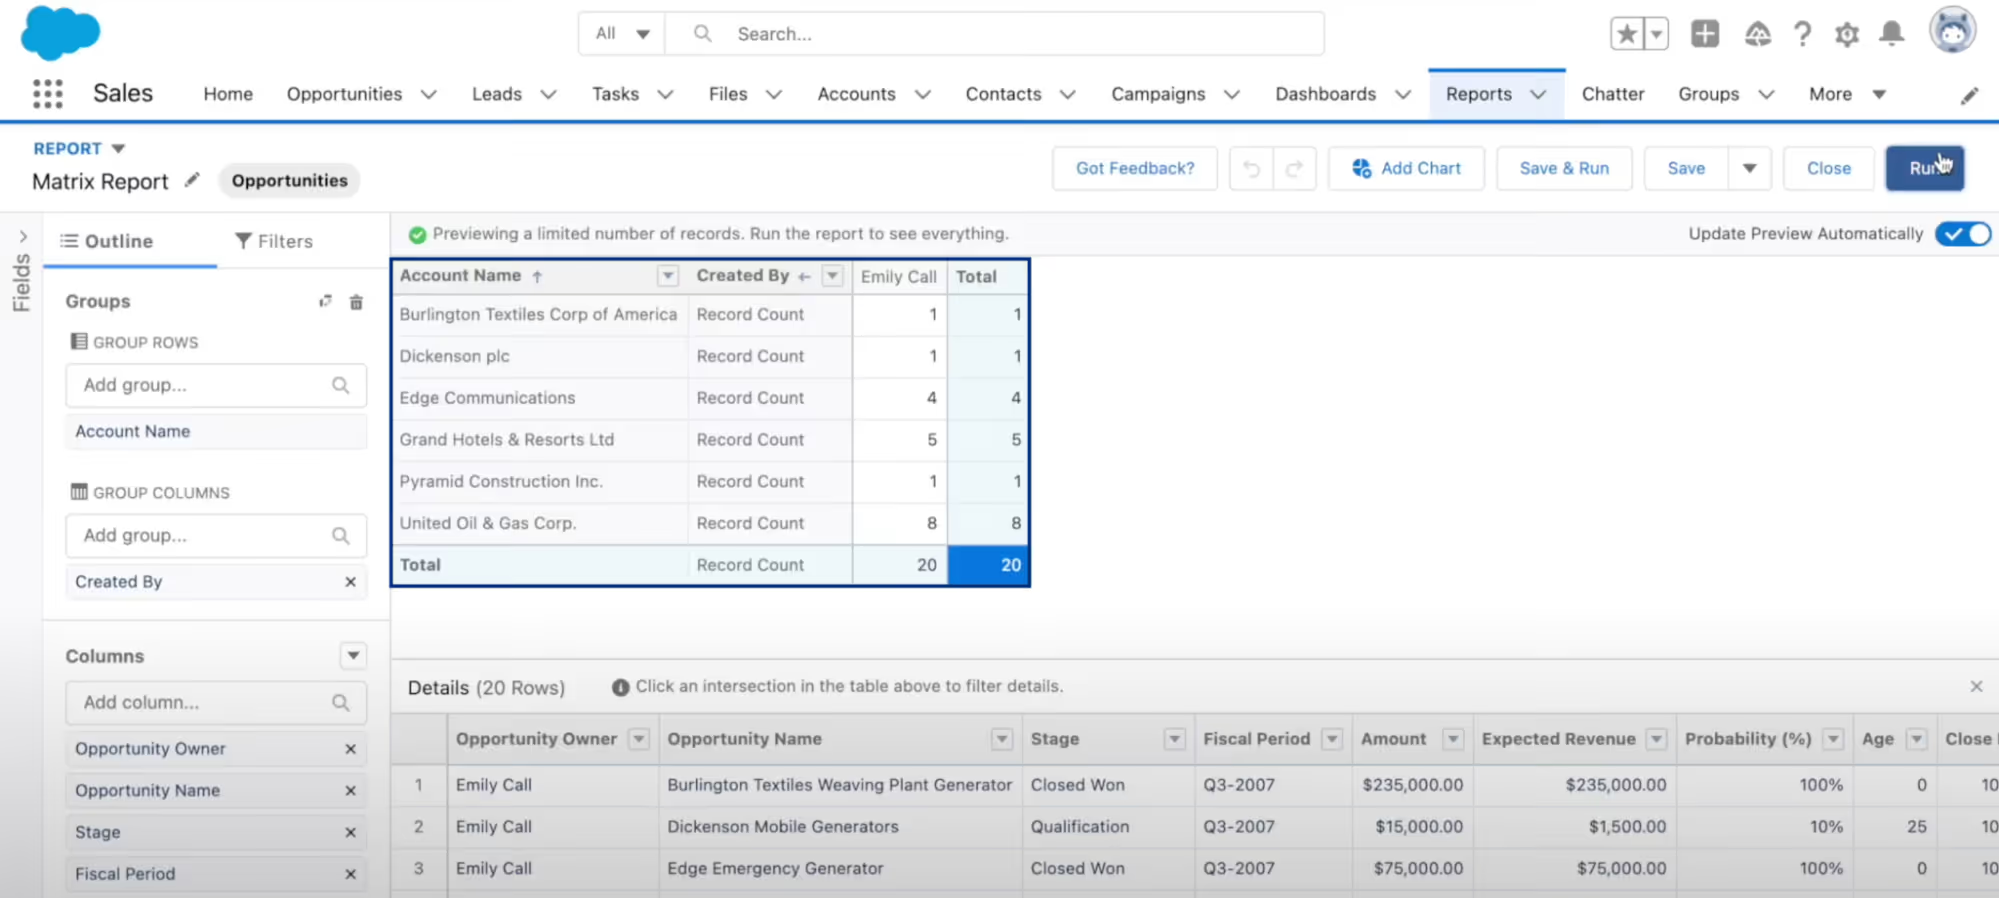
Finally, save your report.
4. Joined reports
A joined report includes multiple report formats and types within a single view. It’s the perfect format for comparing data across different datasets without switching between tabs.
You should use joined reports when you want to:
- Analyze data from different objects (e.g., see the data both at the Accounts level and the Opportunities level).
- Include different report formats in one tab.
- Get a high-level overview of your sales performance data (e.g., for a quarterly performance review).
How to create a joined report in Salesforce
Follow the standard process for creating a new report or choose any existing report and enable the editing mode.
In the top left corner, click on the Report drop-down and switch the format to Joined Report.
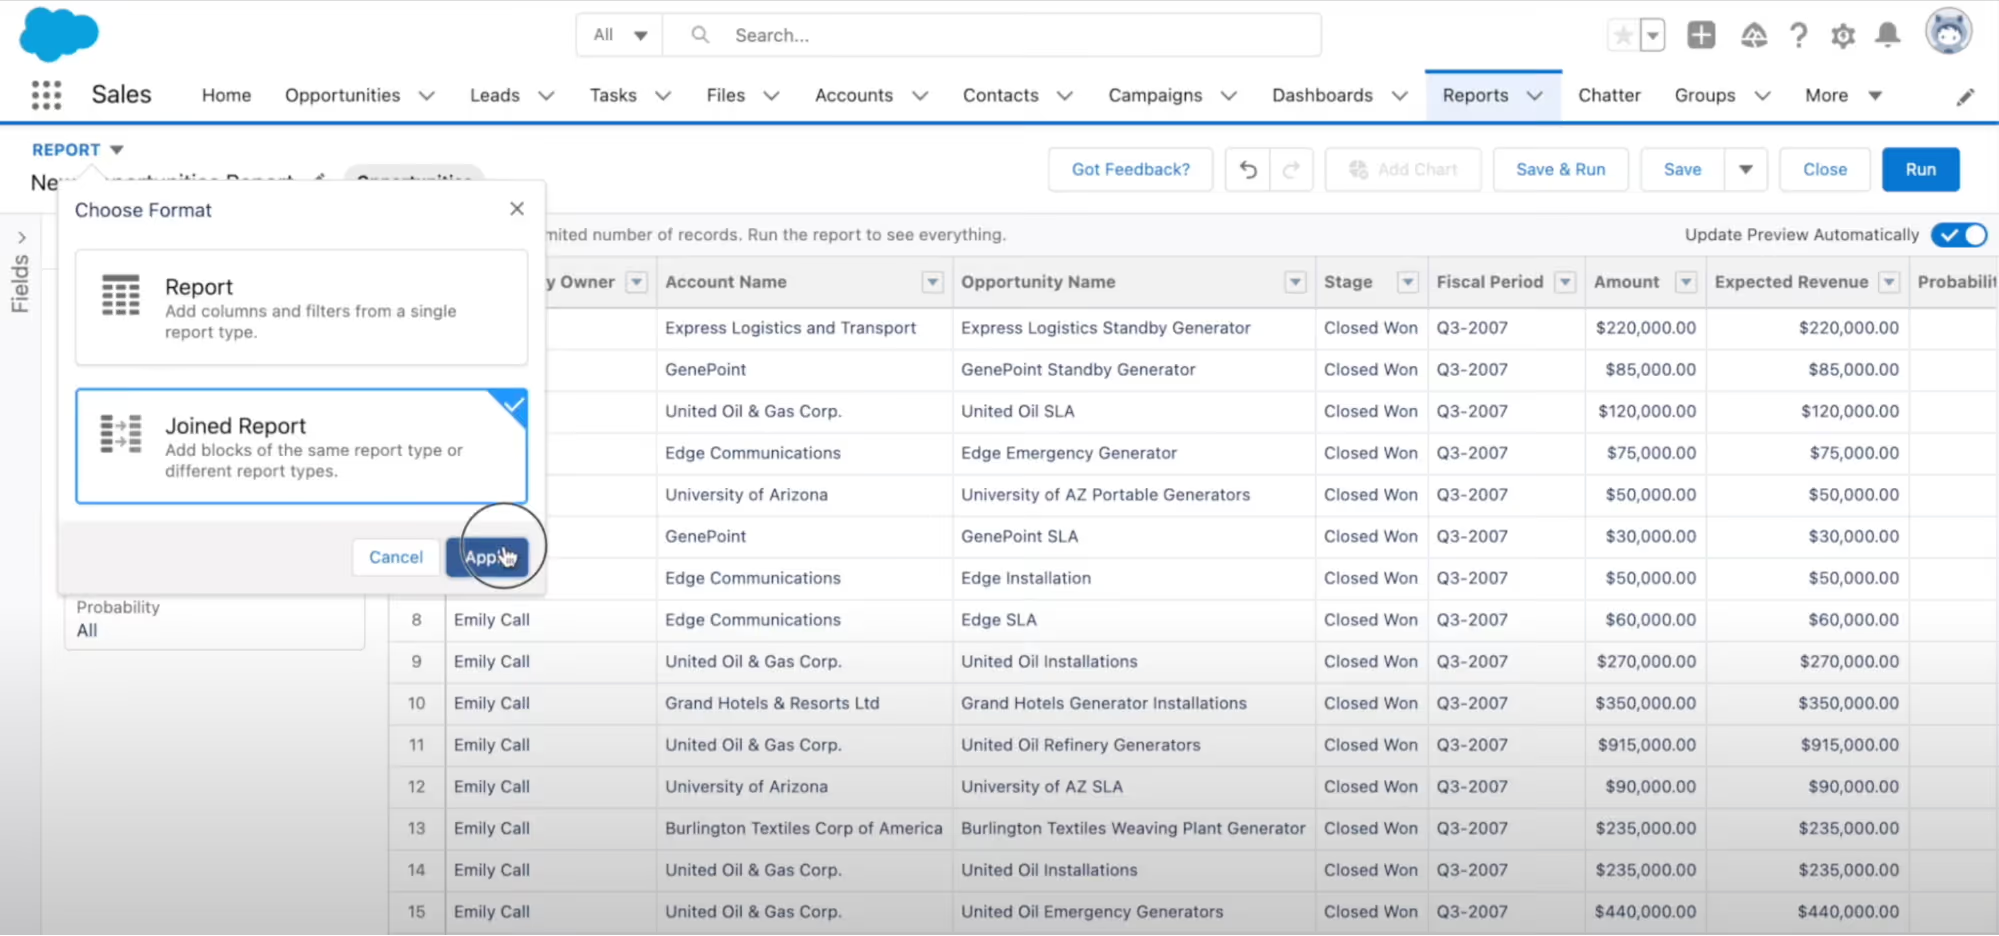
From here, you can add multiple blocks to include different report types and data views in your dashboard.
Apply filters, add or remove columns, or create groups in every block to organize the data.
Save the report when you’re ready.
5. Custom reports
If none of the above reports suit your needs, you can opt for creating a custom report type. Custom report types are basically built from scratch using your chosen combination of fields and objects.
You should use custom reports when you want to:
- Get a comprehensive overview of your business data.
- Report on more than one object at a time.
How to create a custom report in Salesforce
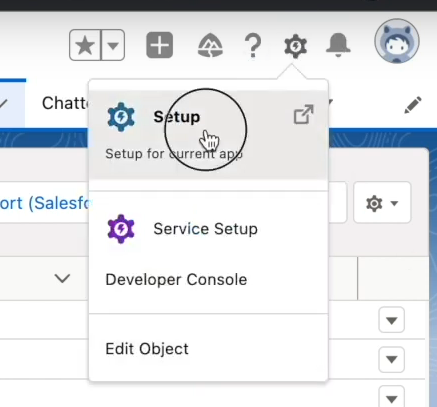
Start by going to Settings > Setup.
Click on Report Type and then on Continue under custom reports.
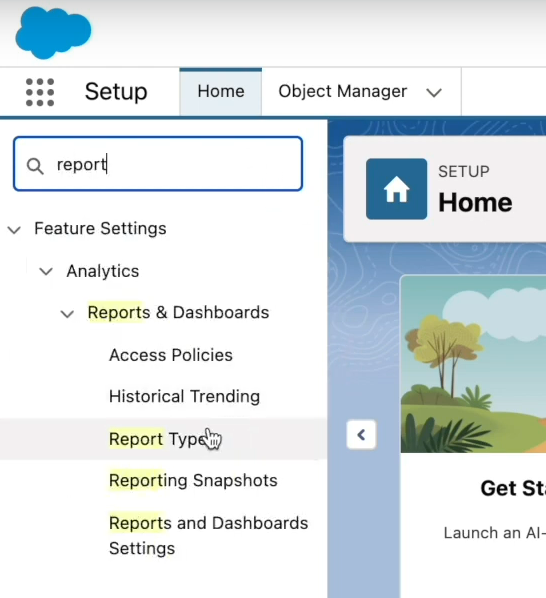
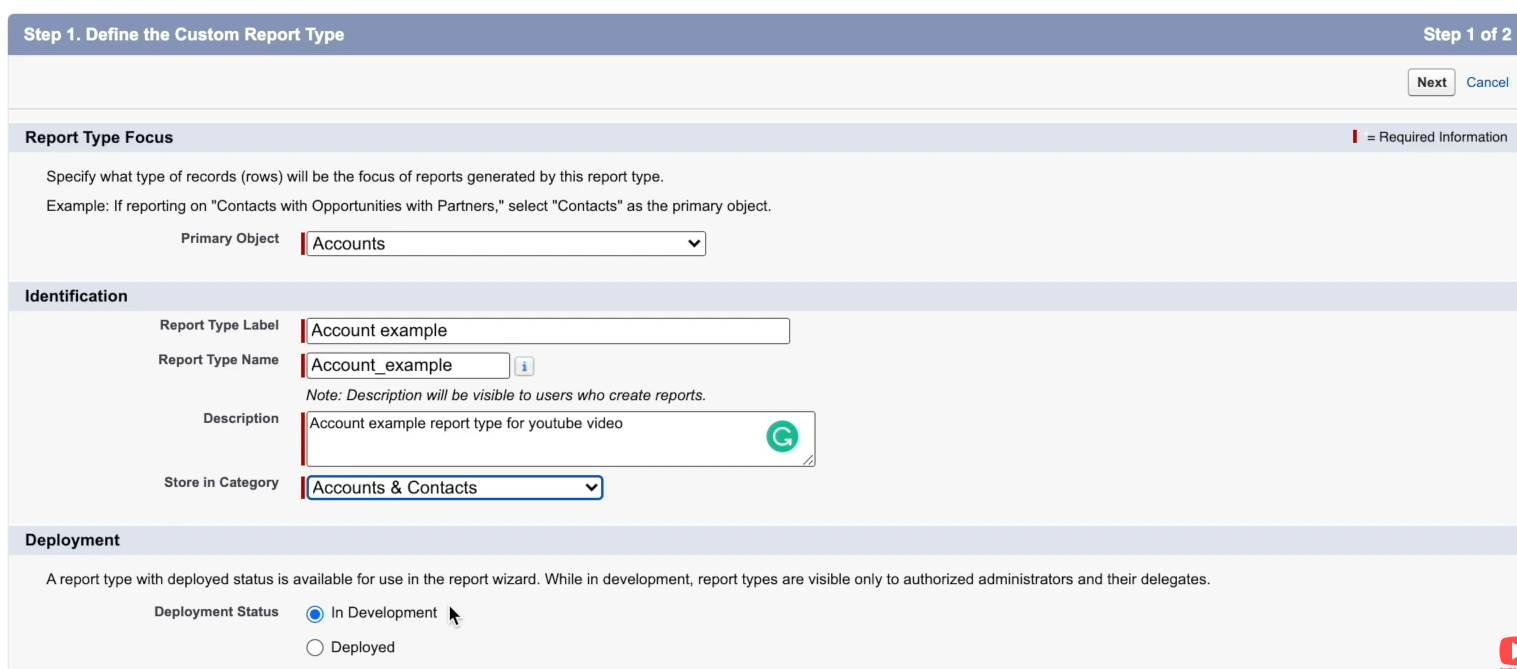
Click the Create new custom report button.
Select the primary object for your report (e.g., Accounts).
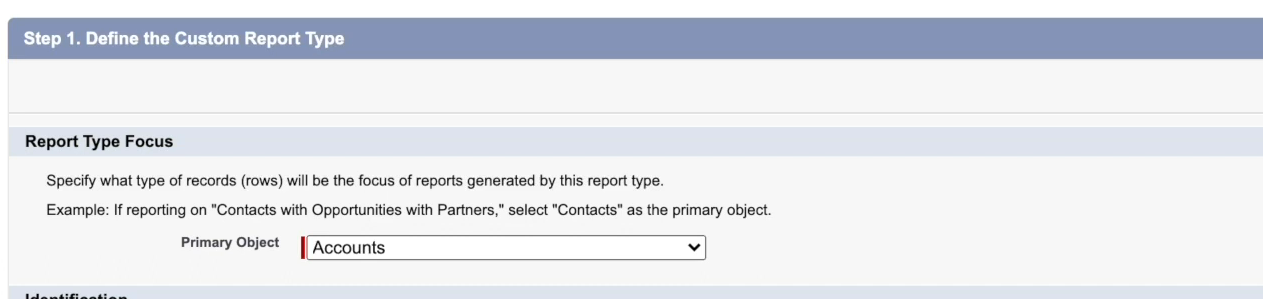
Add a name for your custom report and select a deployment status.
Fill out the remaining fields, and then click on Next.
Now, you’ll need to define the relationships between objects in your custom report. Once done, click on Save.
Next, click Edit layout to select the fields you’d like to include in the report.
Finally, click on Save.
A better way to create Salesforce reports
Despite the variety of report types, the experience of creating and managing reports in Salesforce is hardly seamless.
Limited customization and exporting capabilities, activity tracking and logging issues, and an outdated interface are just a few of the issues users face when it comes to sales reporting.
You can simplify sales reporting in Salesforce by using Weflow’s custom pipeline views. Weflow allows you to review and analyze your Salesforce data more easily and create customized views to see just the data you need.
Here’s how you can create a custom pipeline view in Weflow:
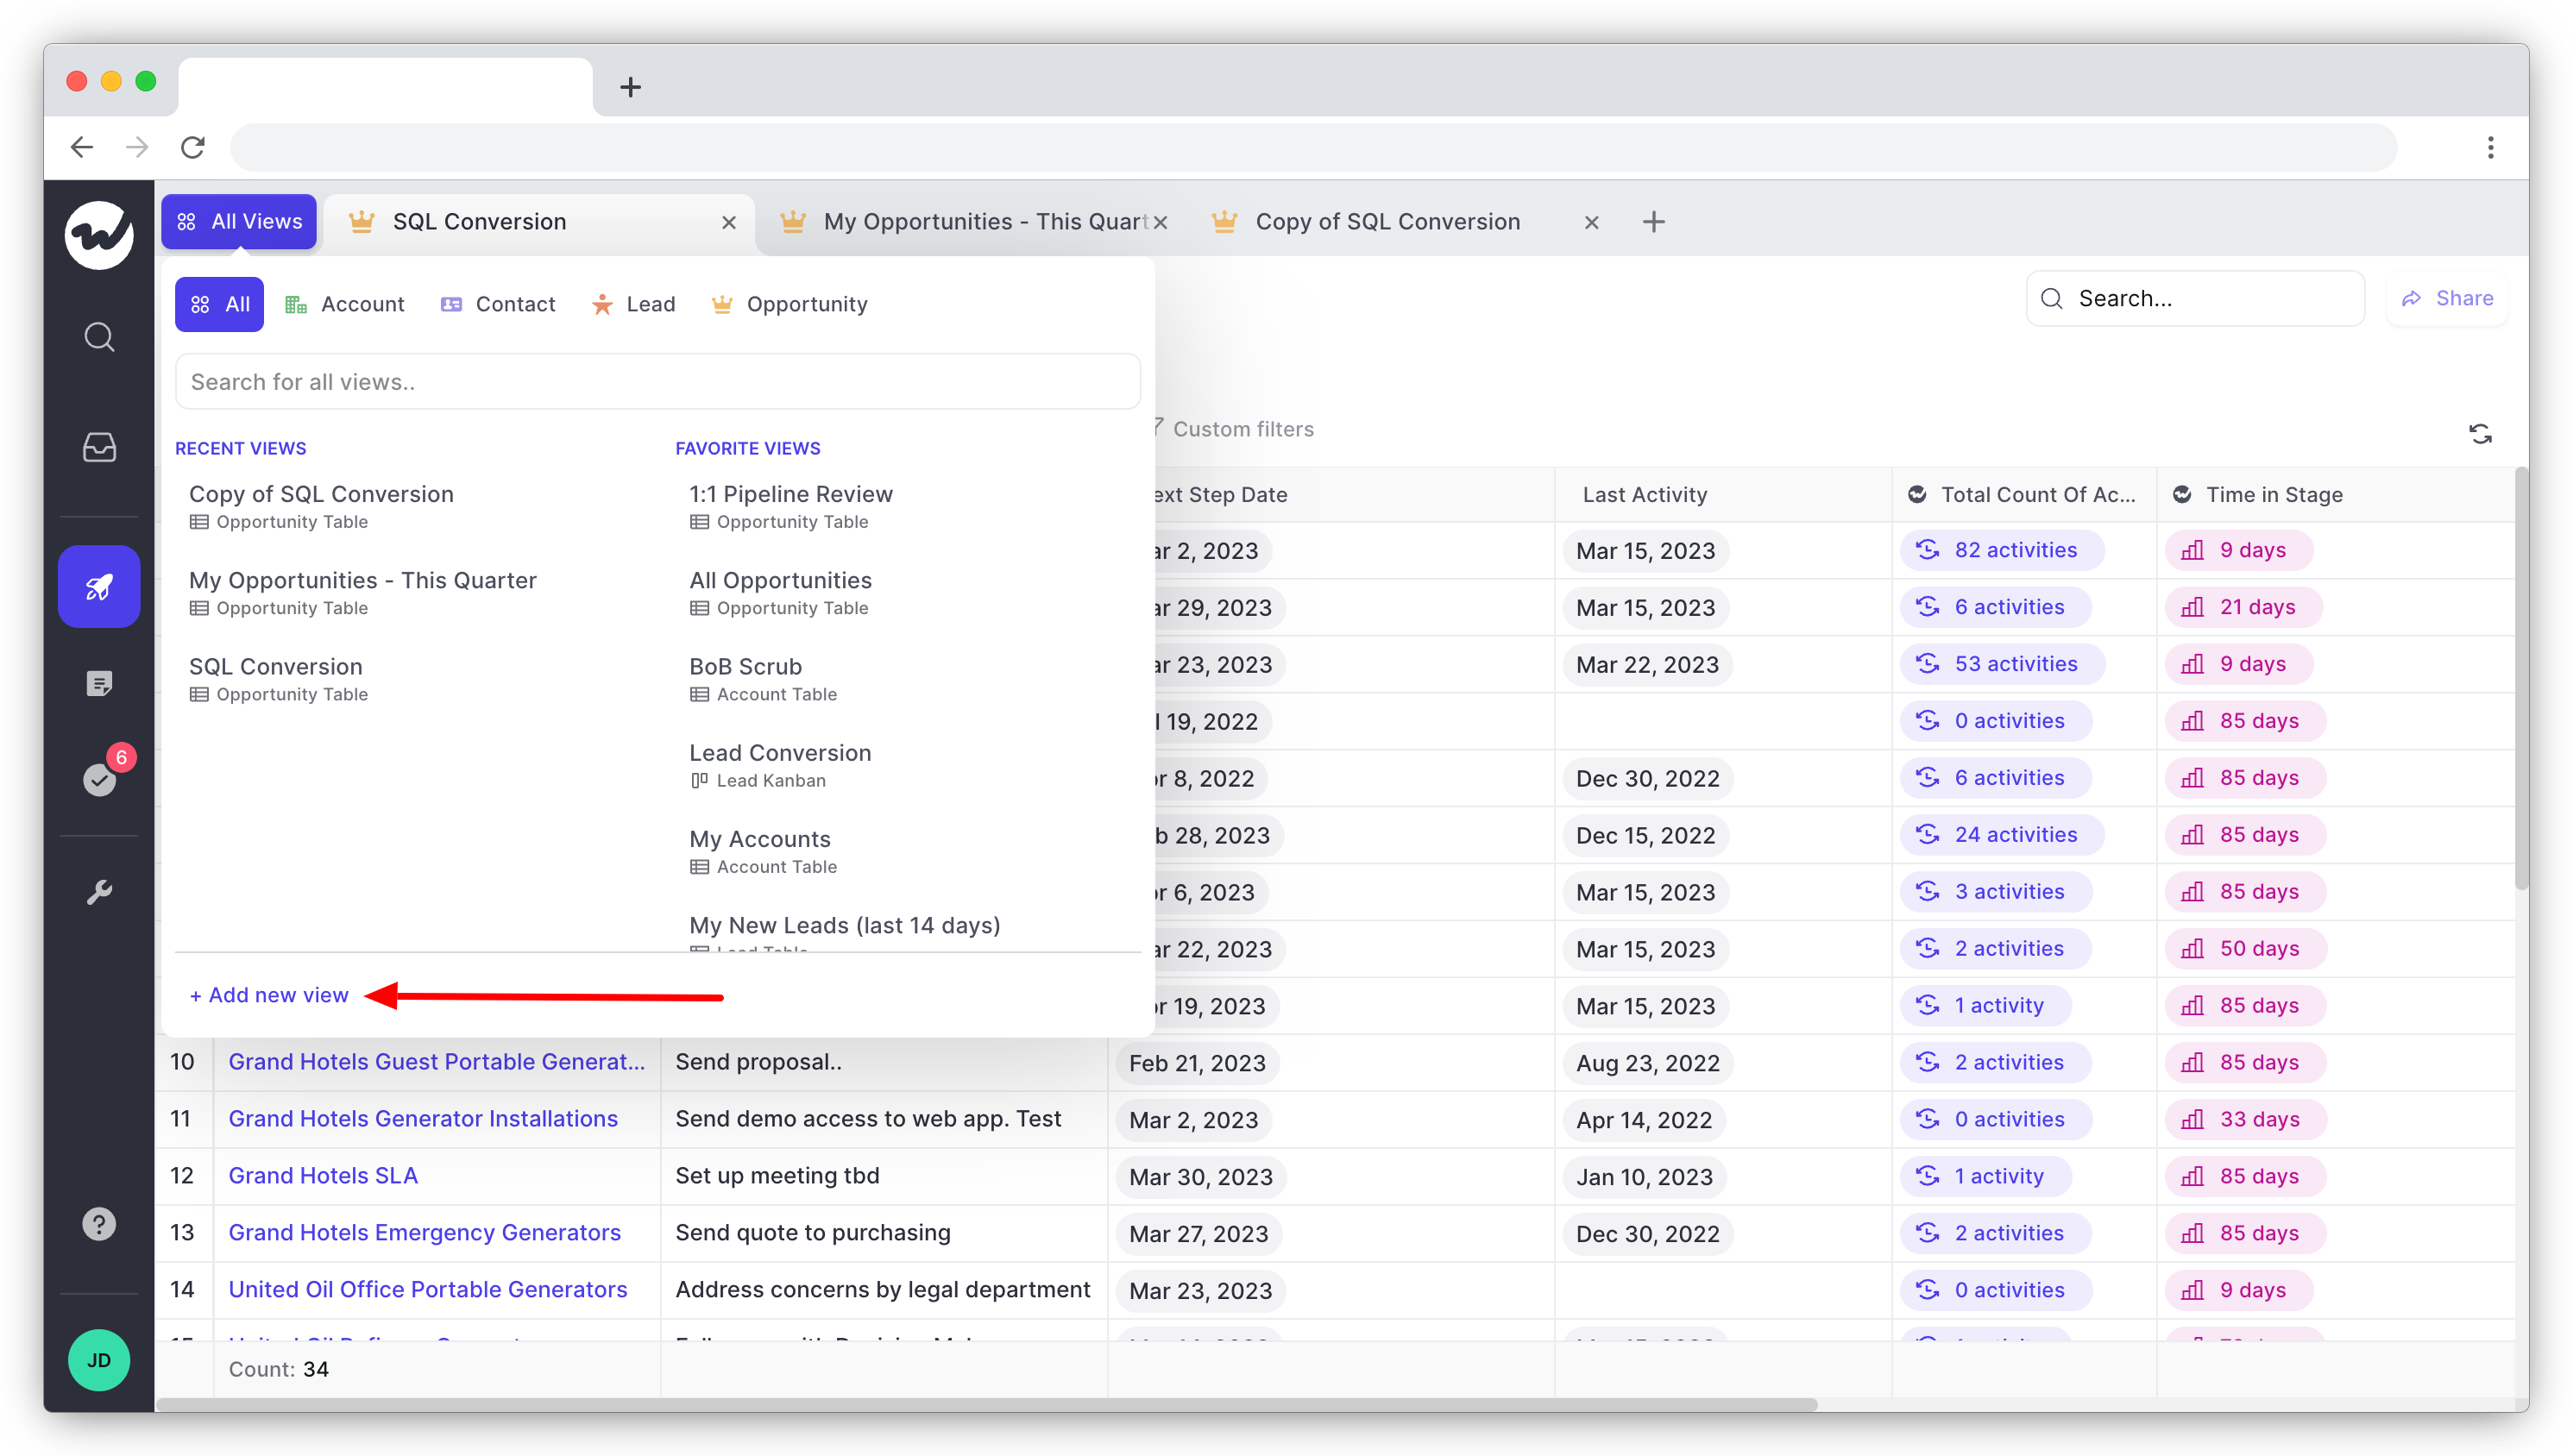
Log into your Weflow account and select Pipeline in the left-hand menu.
From here, click on All views and then on +Add new view.
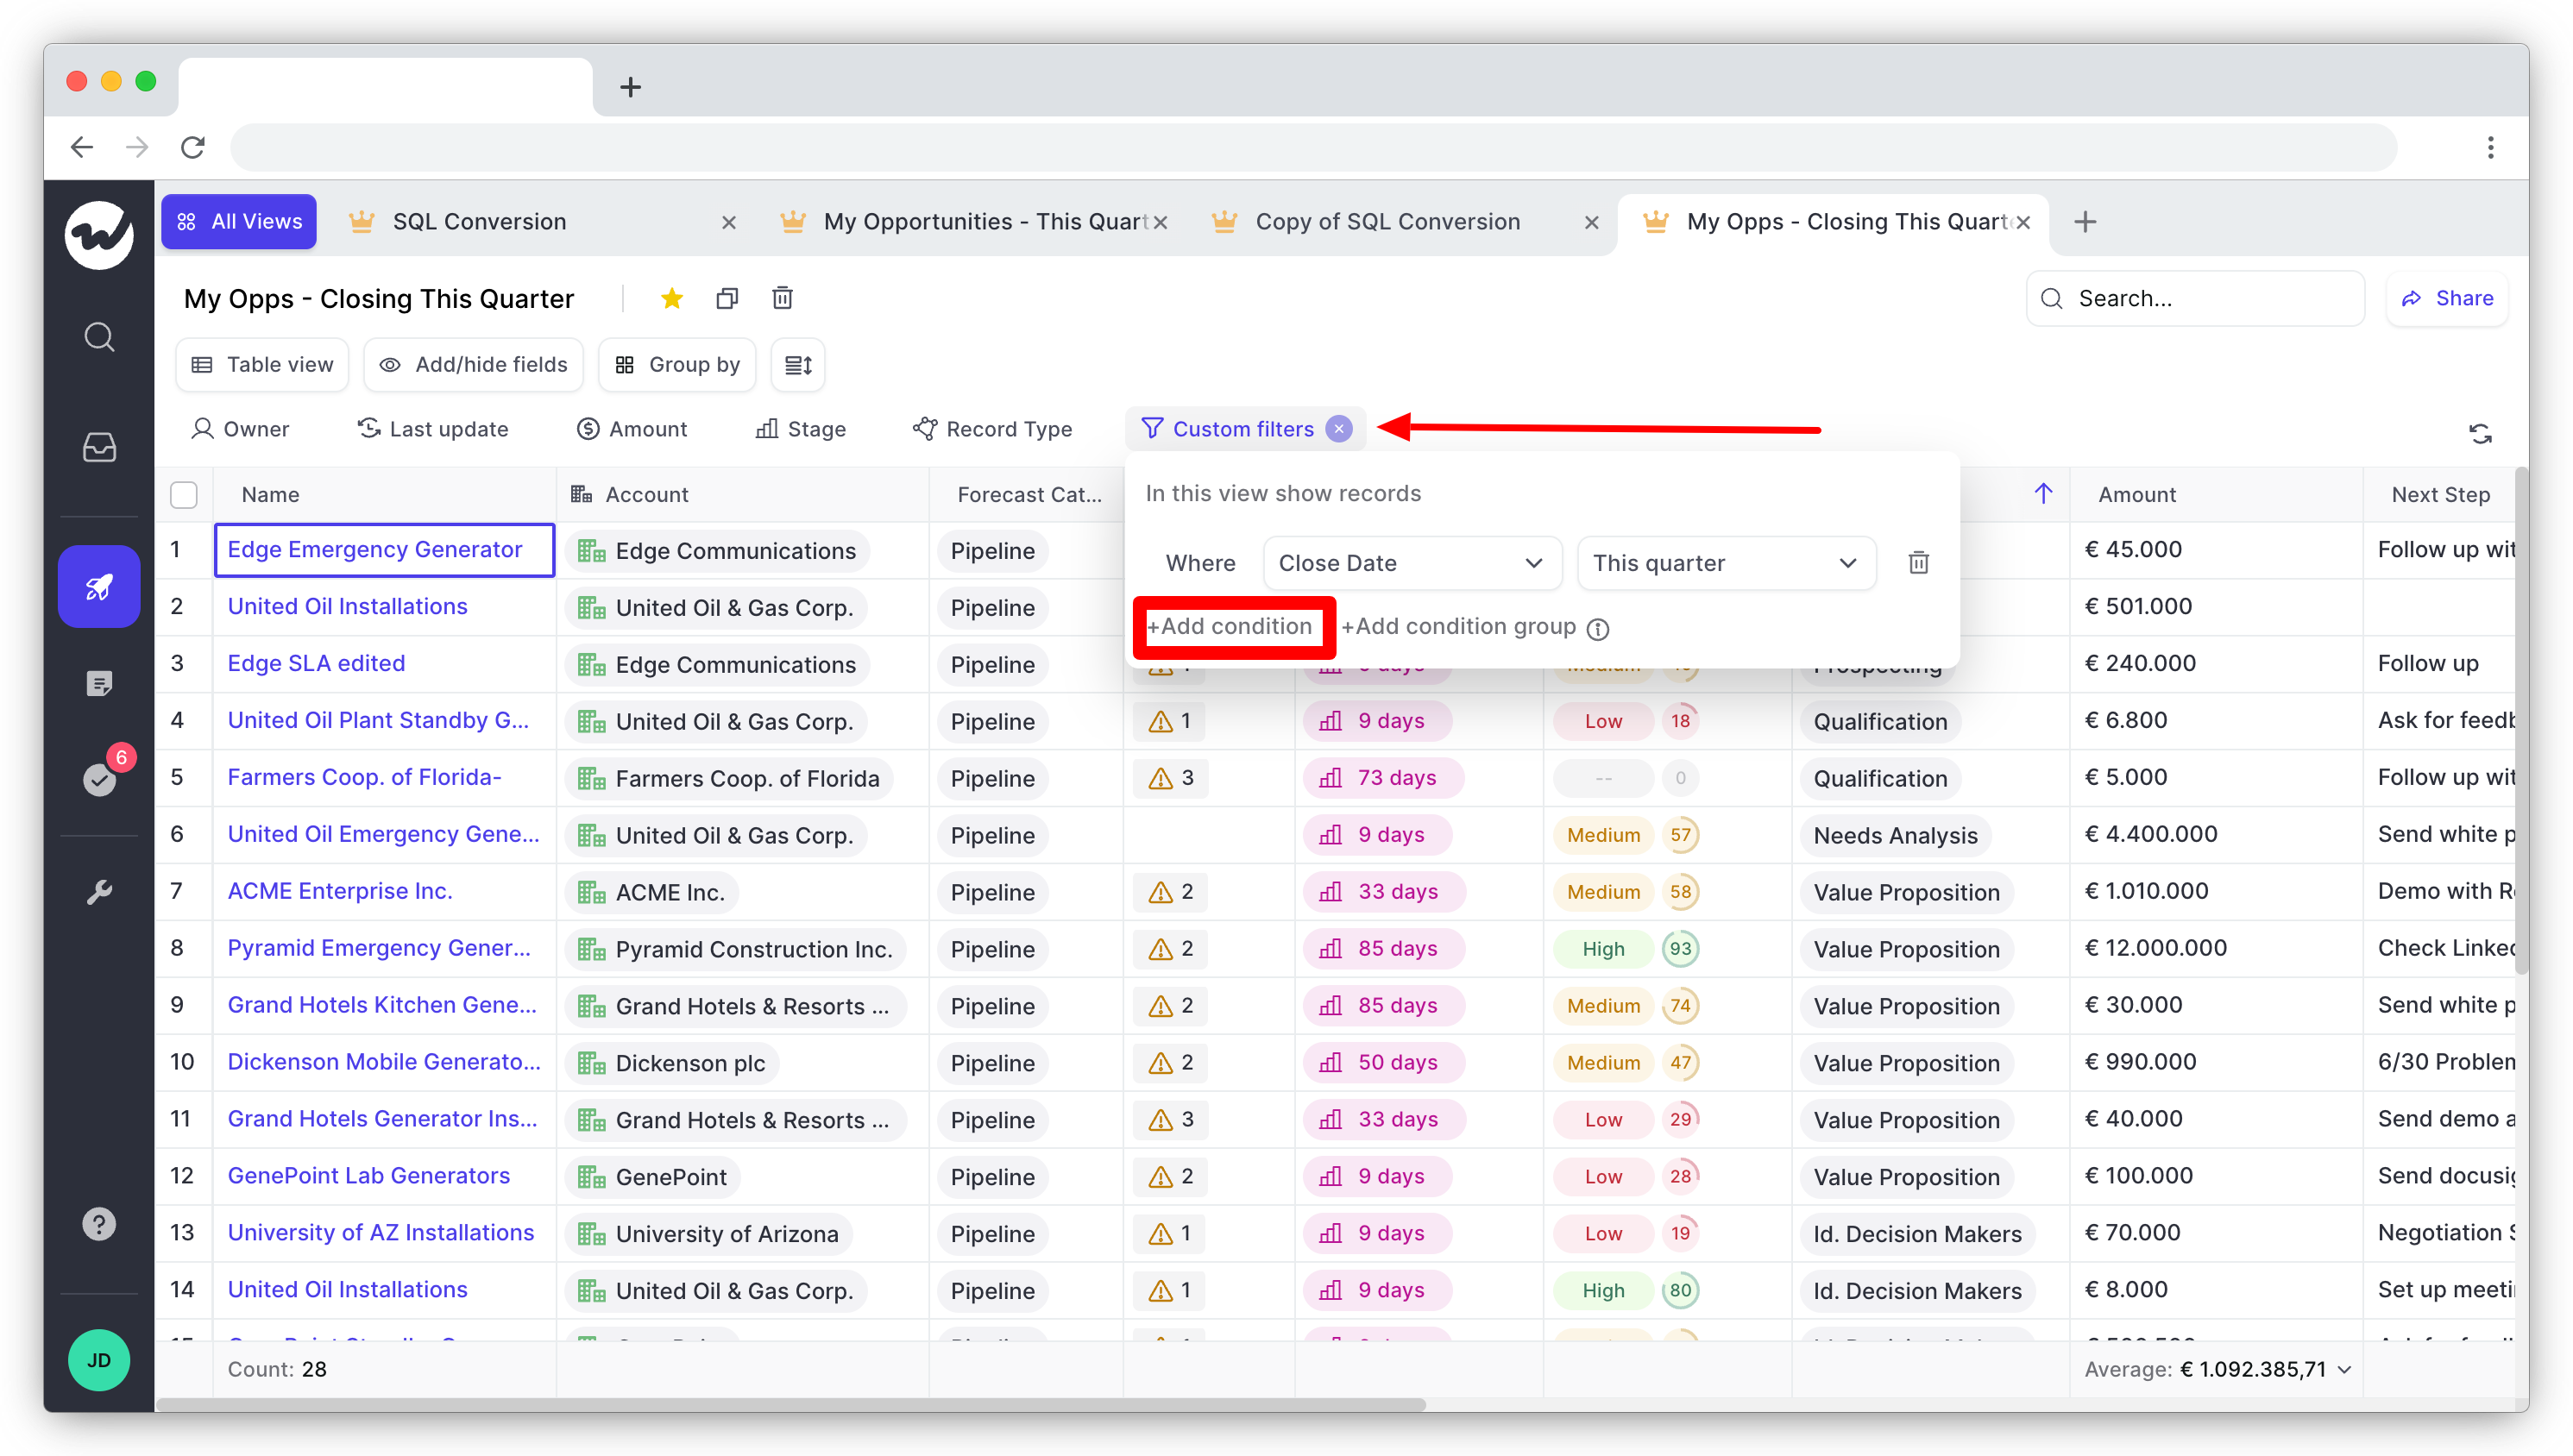
Choose between table and Kanban layouts for your view. Name your view and choose a record type.

You can then customize your view by adding or removing fields and applying custom filters.
Wrap up
Salesforce offers a range of report types and formats that you can use to view your sales data from different angles.
Use our guide to find the right report type for your needs, or try out Weflow to streamline Salesforce reporting.