How to Create a Report in Salesforce: A Step-by-Step Guide
Are you ready to up your data analysis game?
Salesforce can be confusing to learn, but with just a little finesse, it can make you a force (heh) to reckon with.
And it doesn't take much to get started!
Salesforce reports are one of the most powerful tools you can use to understand your business data. With well-generated reports, you can easily get to the bottom of complex trends, gather insightful data points, and improve decision-making.
By harnessing the analytical power of Salesforce reports, you'll be able to get an in-depth look at your business with just a few clicks.
In this guide, we’ll go over the different types of reports in Salesforce and show you how to create a report in Salesforce.
Types of Salesforce reports
A little bit of background: Salesforce reports are based on 'objects' in the system. An object is like a table with columns and rows. For example, an "Accounts" object might have columns for name, address, and contact information, and each row would contain information about a particular account.
Standard reports
Standard reports include columns from a single object, and you can choose which fields to include in the report. There are four Salesforce report types that fall under the category of standard reports:
Summary reports
A summary report allows you to group data by certain criteria. For example, if you wanted to look at total sales for each region, you could create a summary report that groups the data by region and shows the total sales for each one.
Matrix reports
If you need more flexibility in your reporting, then a matrix report is the way to go. These types of reports allow you to include multiple objects in a single report and can even have rows and columns that “cross” each other, like a pivot table in Excel.
Tabular reports
A tabular report has an extra layer of detail. It includes data from multiple objects and allows you to view related records in the same report. These are great for getting a fuller picture of the information you need.
Joined reports
These are the most complex types of reports. A joined report allows you to combine data from multiple objects and even create custom formulas and calculations, which are especially useful for forecasting.
Custom reports
Salesforce custom report types are created from scratch, meaning you can build your own report framework with a combination of fields and objects. These are incredibly powerful but also require a bit more technical know-how.
A custom report format is useful for getting a comprehensive view of your business data, and it can be used to track progress and performance over time. They are especially handy for complex forecasting scenarios and when you’re reporting on more than one object at a time.
How to create a report in Salesforce
Now that you know the basics of what Salesforce reports can do, let's take a look at how to actually create Salesforce reports.
Log in to your Salesforce account and go to the Reports tab.
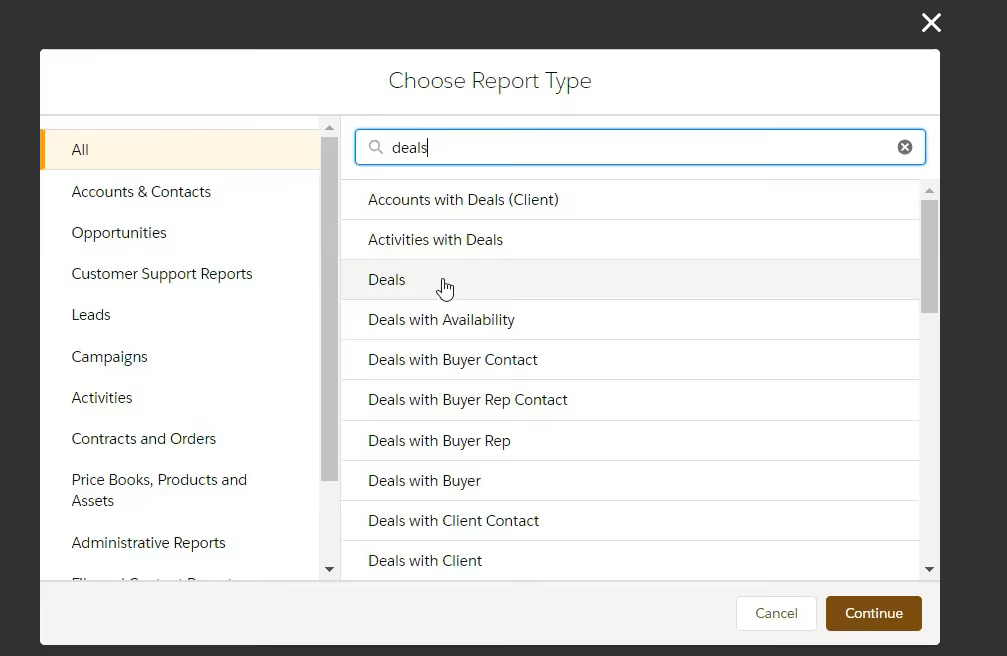
Click on New Report and select the type of data you’re looking to report on. This is the report type. You can type in keywords to find the report you’re looking for before selecting Continue.
Then you can filter your data on the top left panel for your report. Here, you can narrow down the fields you want your report to display as much as you want. For example, if you only want to see deals won, simply click on Add Filter…
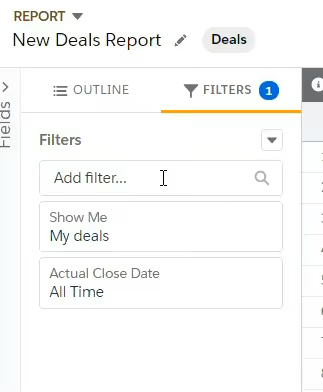
Type in Status.
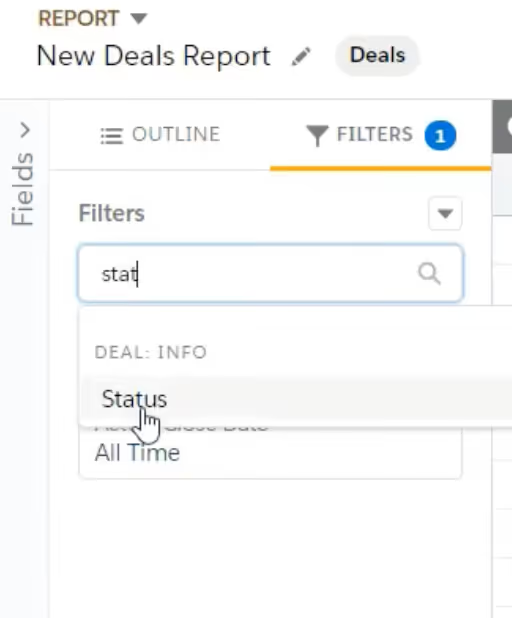
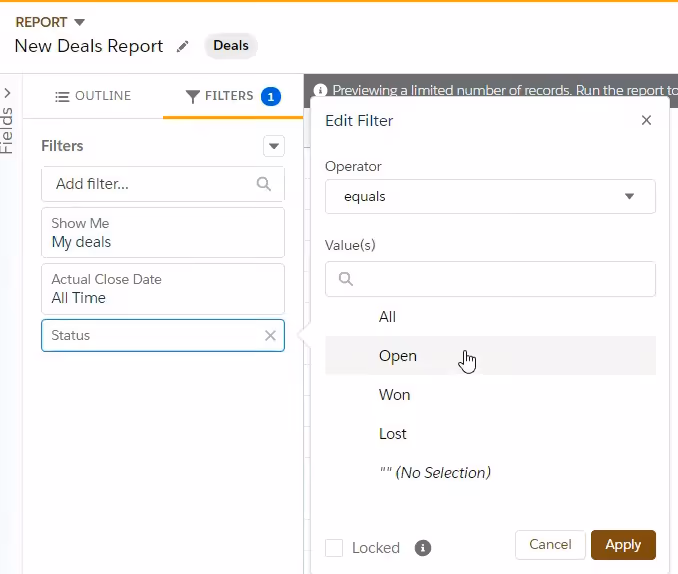
Then in that Status filter, select Won under Value(s) and click Apply.
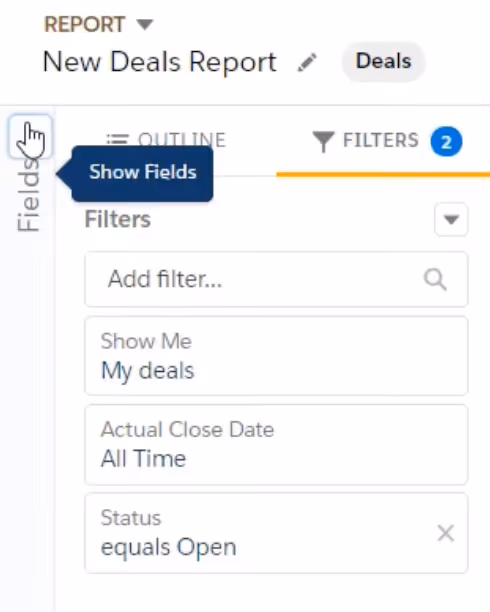
From here, choose which fields you want to display and how they should be grouped (if applicable).
First, just click on the arrow tab on the far left.
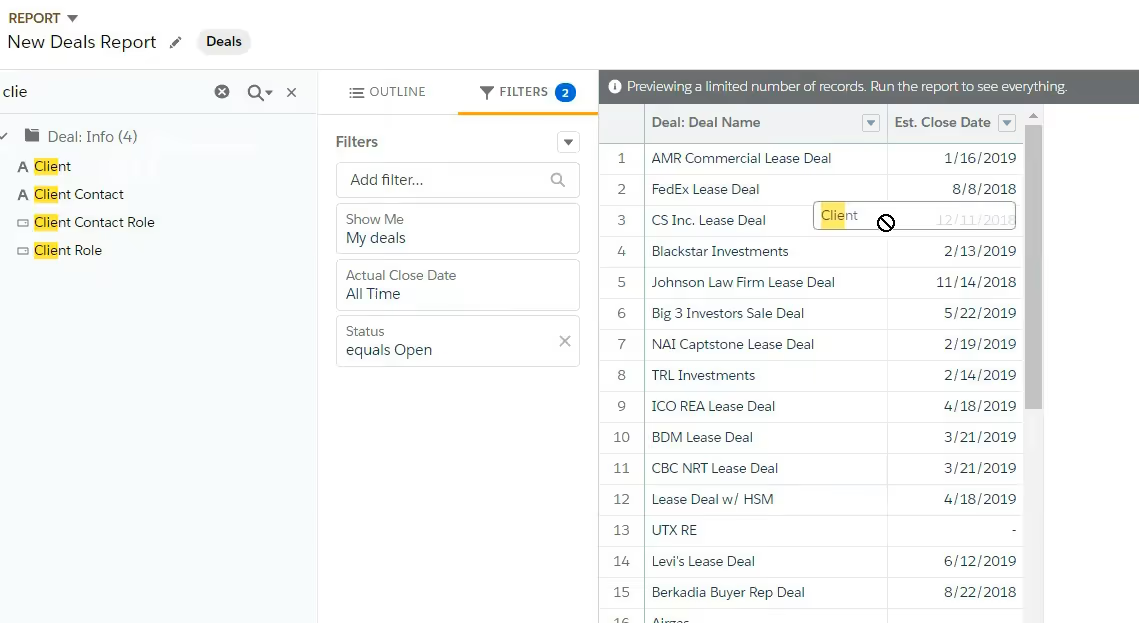
Then you can search and simply drag and drop any fields into the table report like this.
You can save the report by clicking on Save.
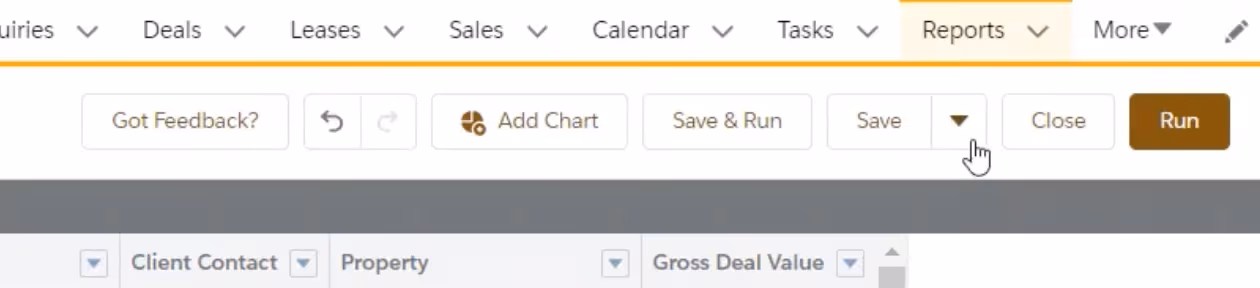
Simply give the report a name, decide which folder the report should be saved to (private, public, custom, etc.), and click Save.

Run the report and adjust any settings as needed.
And that's it! You now have a new Salesforce report that can be used to analyze your data and track progress.
How to create a custom report type in Salesforce
If you want to generate more complicated Salesforce report types for complex sales pipeline reports, it takes a little bit more work.
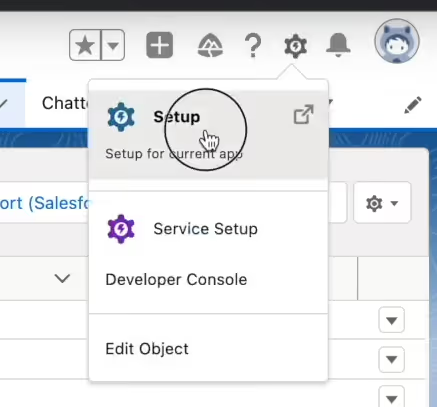
You’ll need to go into the settings and select Setup.
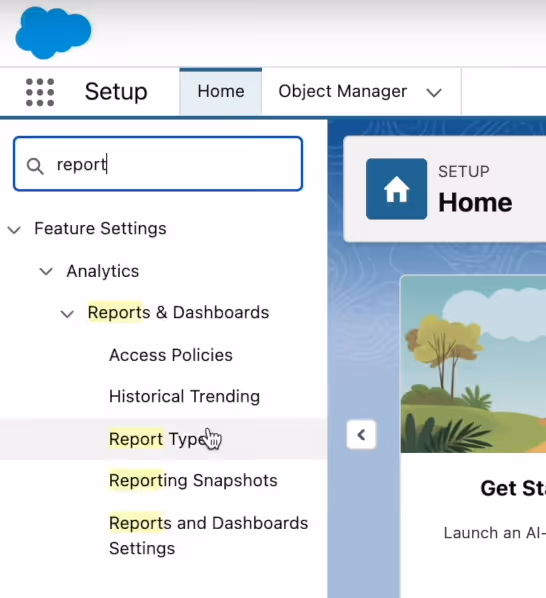
Click on Report type in the quick finder, then click Continue under custom reports. After that, click on the Create new custom report button.
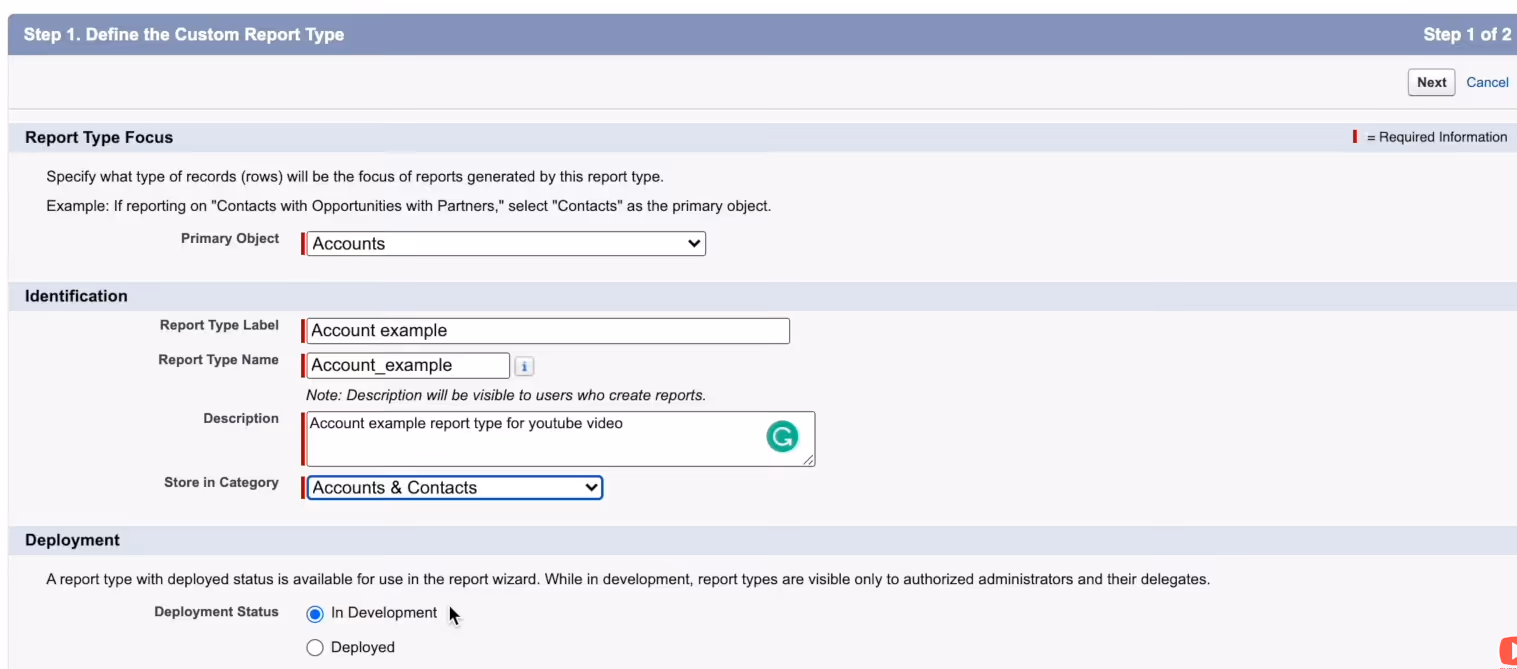
Select the primary object. Accounts is a safe choice.
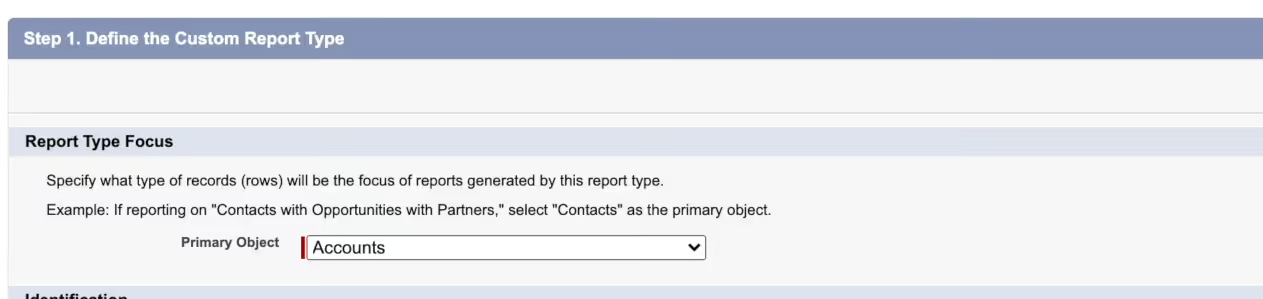
Then, name your custom report and select deployment status. If you work in a large company and the tool is used by many people, it’s recommended that you select In Development because this status makes the report private, and others cannot edit it. The only thing you need to do is manually deploy it when it’s done.
Make sure that all of the fields with a red line are filled in, and after you finish, click the Next button in the right-hand corner.
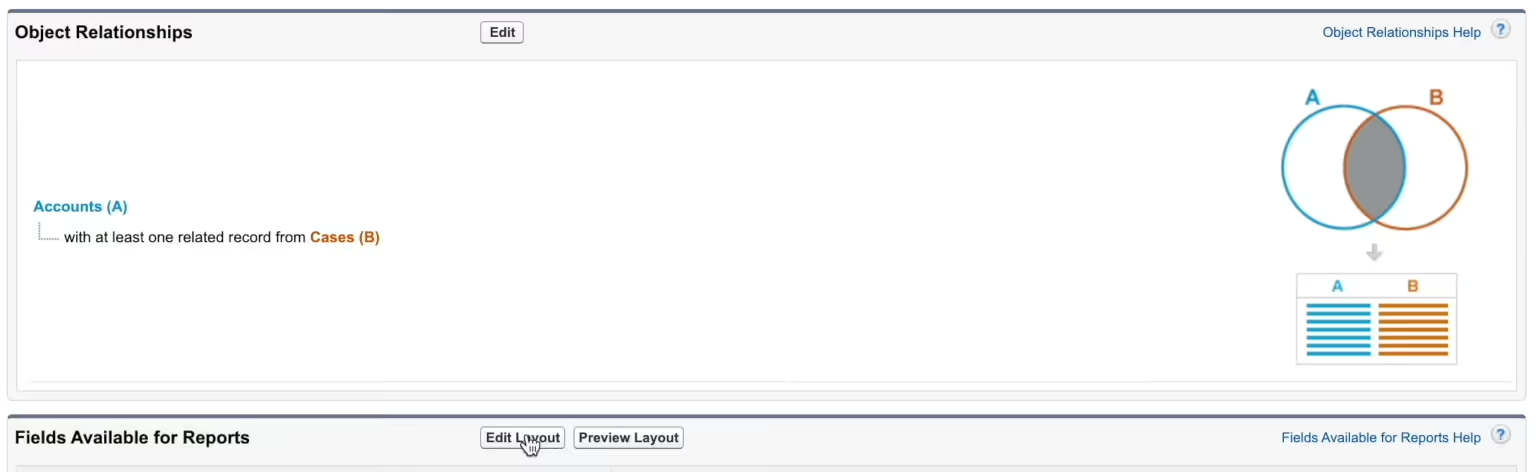
Next, you need to define the relationships between objects in your custom report. Add an object and select how it relates to the primary object, which is Accounts in this case.
Pay attention to the Venn diagram if you get confused about how the object relationship affects the output.

This is a very simple example. If you need, you can add more details to it.
Don’t forget to click Save!
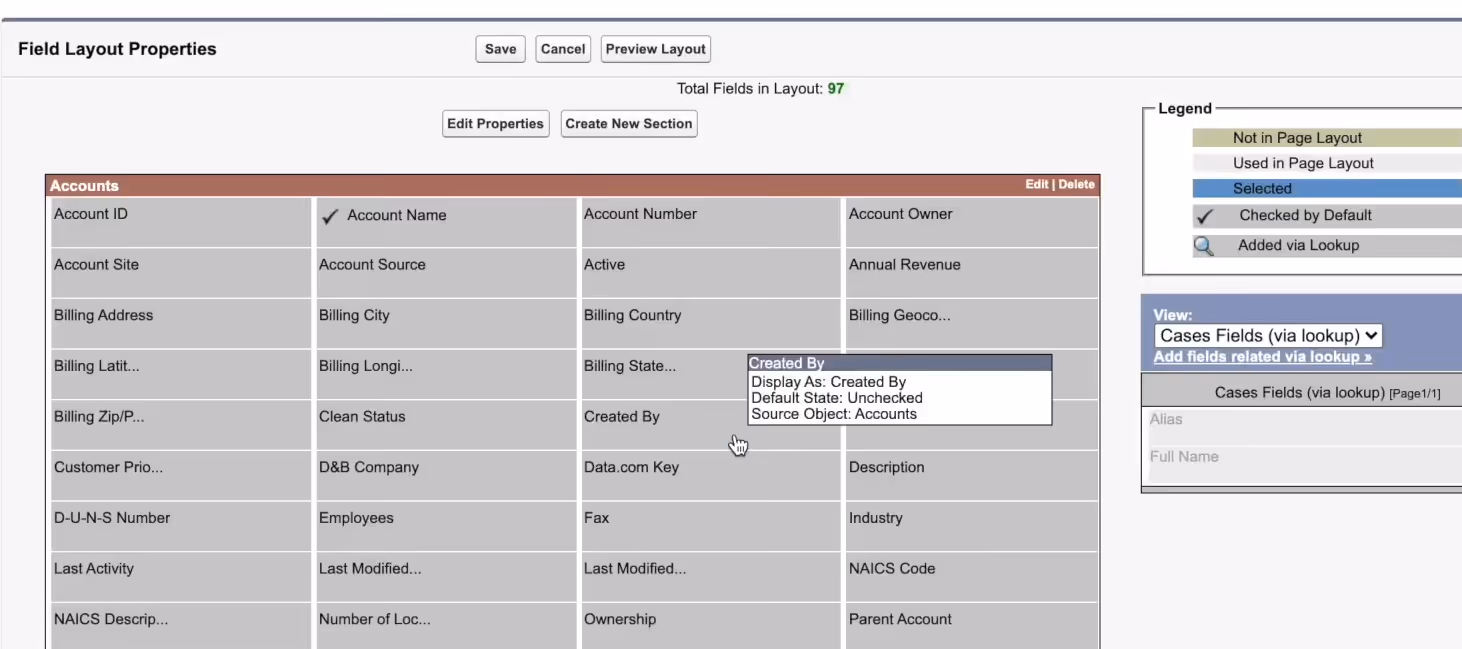
Then, you can select the fields you want to include in the report. First, click on Edit layout.
From there, you will see a menu where you can select the fields of interest for this report. You can also relate fields from other objects, including those which you haven’t added to the initial relationships. Do that by clicking on the Add fields related via lookup button on the right.
Once you’re done creating your custom report type, you need to click Save, and then you’ll have the option to change the status to deployed so it can be used by other people. Just click the Edit button next to the Custom Report Type Definition heading.
Now, when you’re creating a new report, you’ll have the option to choose this Salesforce report type from the regular menu.
Limitations of Salesforce reports
Now, unfortunately, the Salesforce report builder isn’t without its limitations.
For one, it doesn’t support visualization, so any graphs or charts you need will have to be generated separately. Reports also time out after ten minutes, which means that if your data takes longer than ten minutes to generate, Salesforce cancels it.
You can try running it again, and it might succeed the second time since the data is cached, but there's no guarantee.
Additionally, reports are limited to 2,000 rows of data—so if you need more than that, you'll have to export the report to a spreadsheet and do additional analysis there.
And since reports are based on objects in the system, they can only work with the data that’s already there — they can’t be used to create new data points or modify existing ones. This means that if you need to do any sort of advanced calculations or data manipulation, you’ll have to find an external solution.
A better way to create sales reports
With such a restrictive limit to how much data you can process, it can be difficult to get to the information you need quickly without an external Salesforce reporting tool.
That’s where Weflow’s super intuitive interface can help!
If you have your Salesforce data synced with Weflow, you can create custom pipeline views that make it easier and quicker for you to access the data you need.
All you have to do is:
Log in to your Weflow account and click on Pipeline in the left-hand menu.
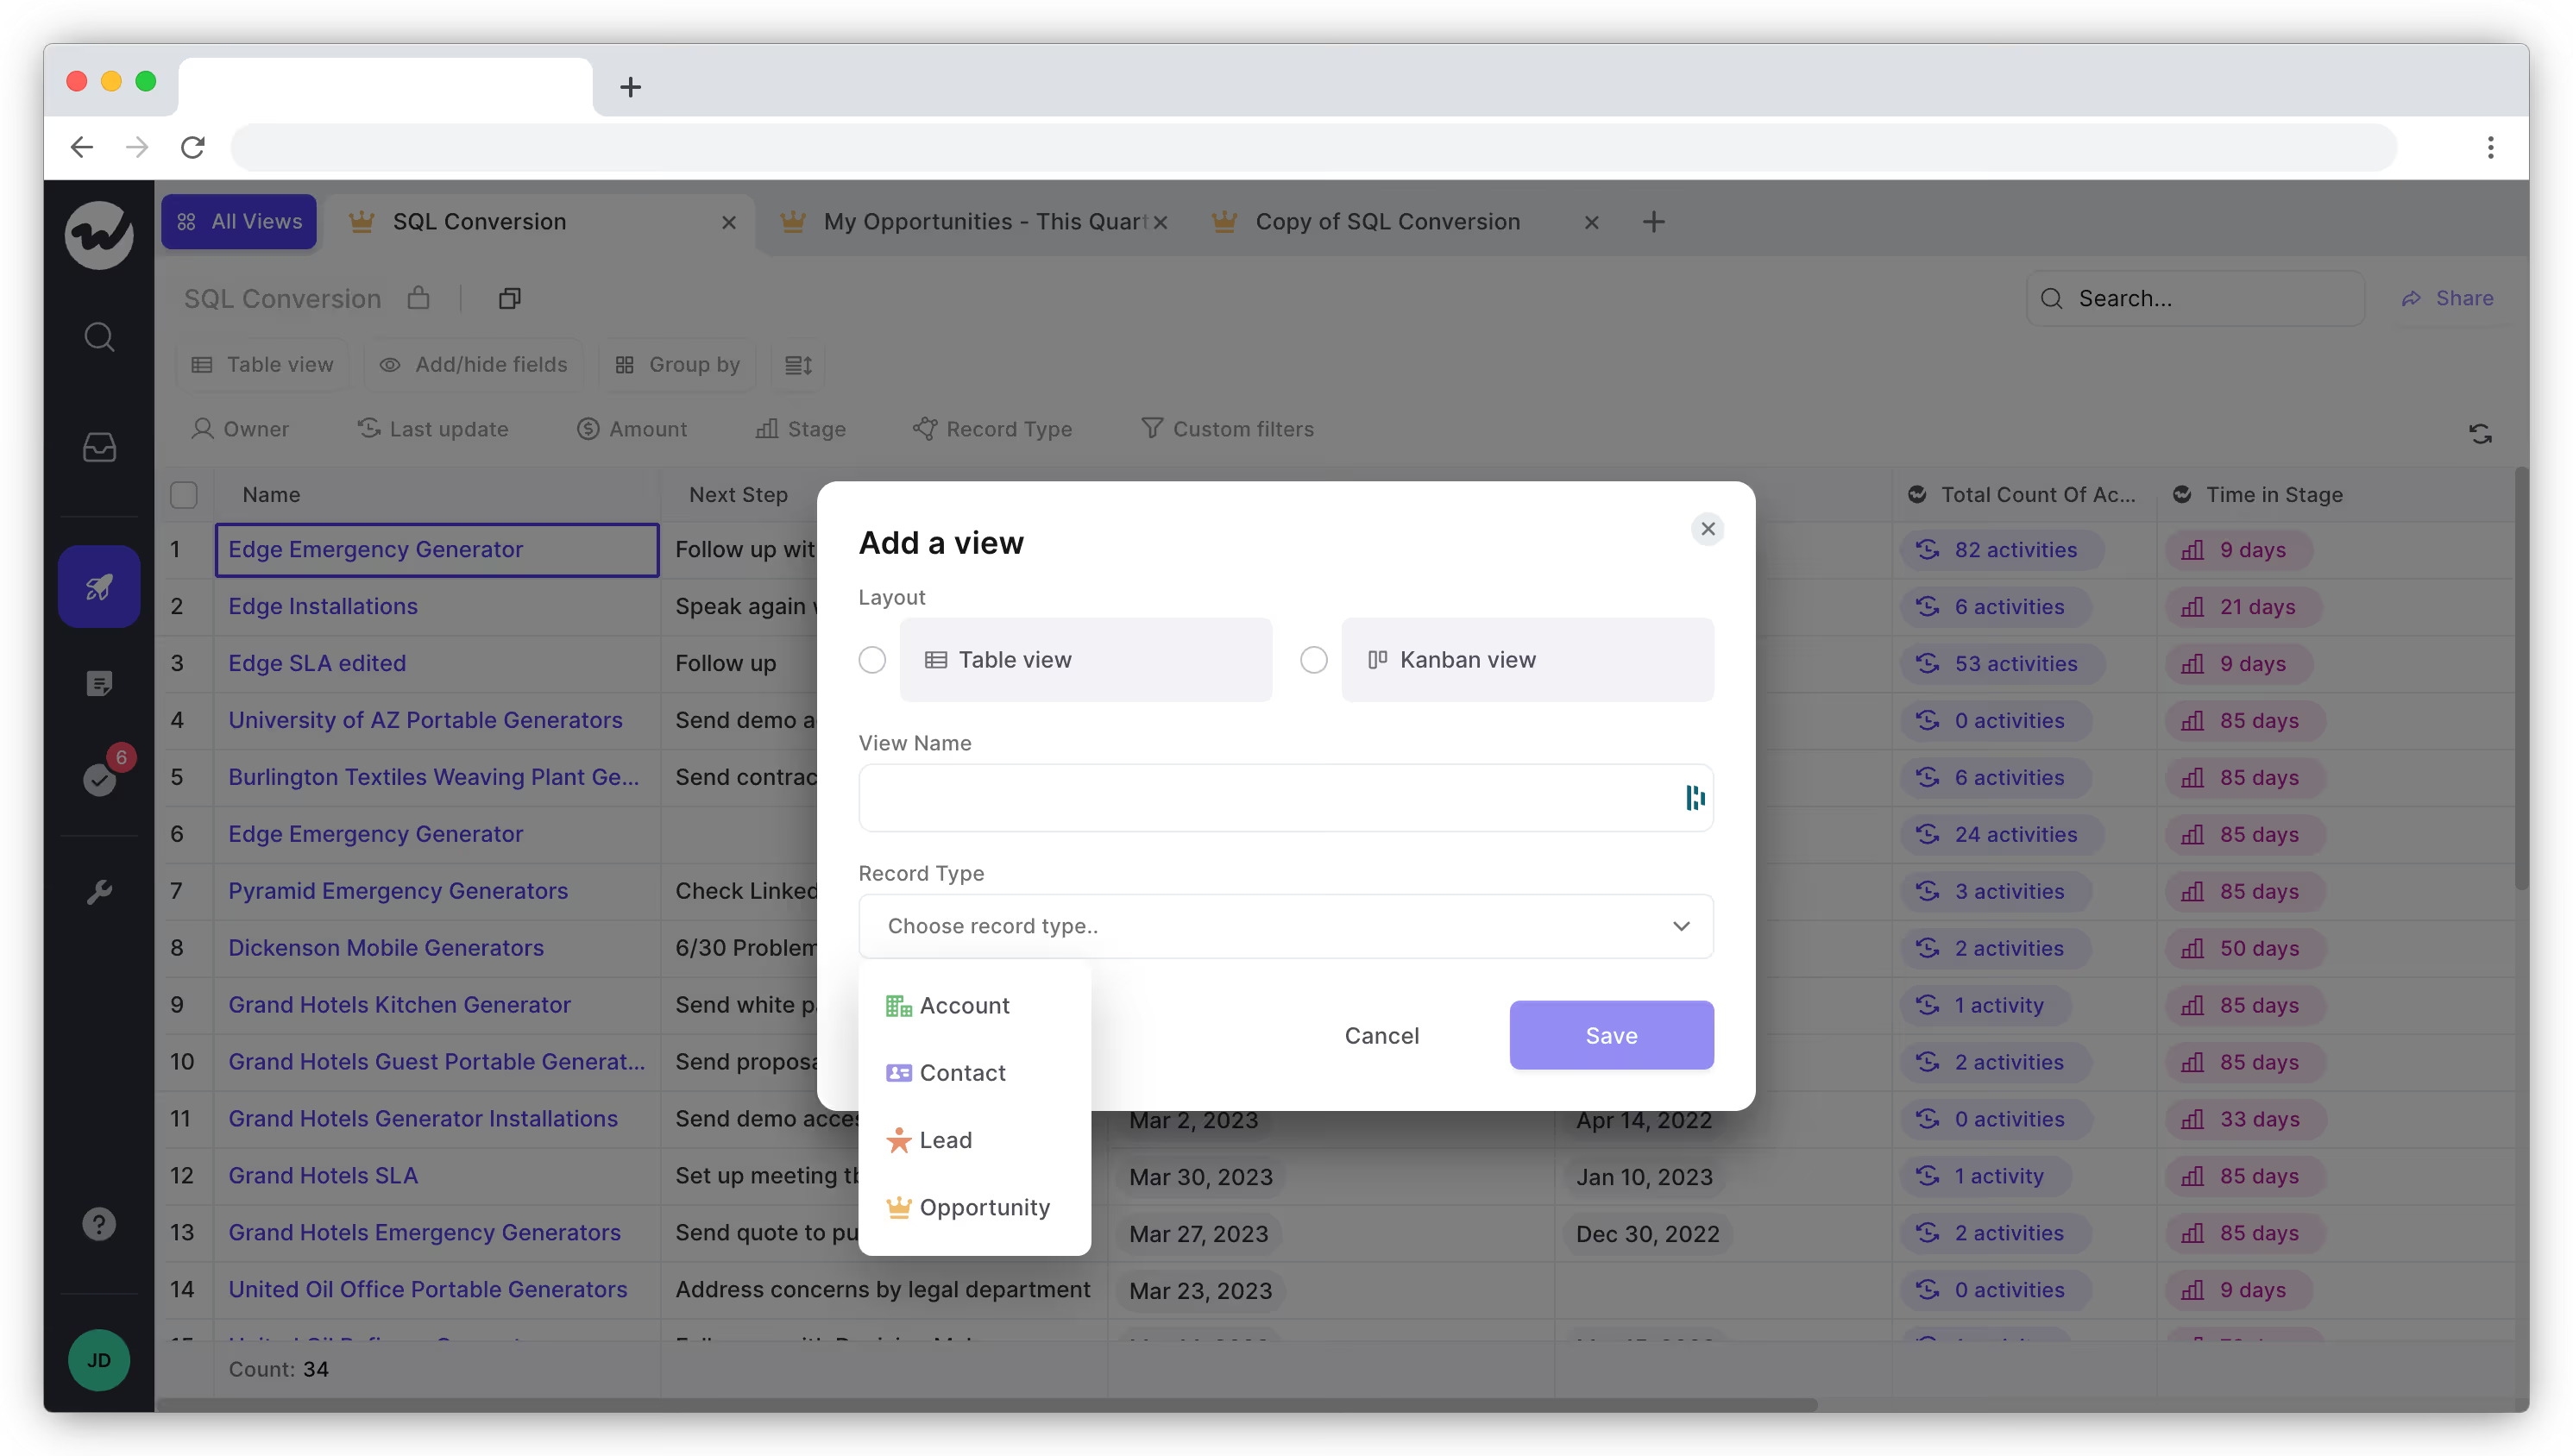
Select All views and click on Add new view.
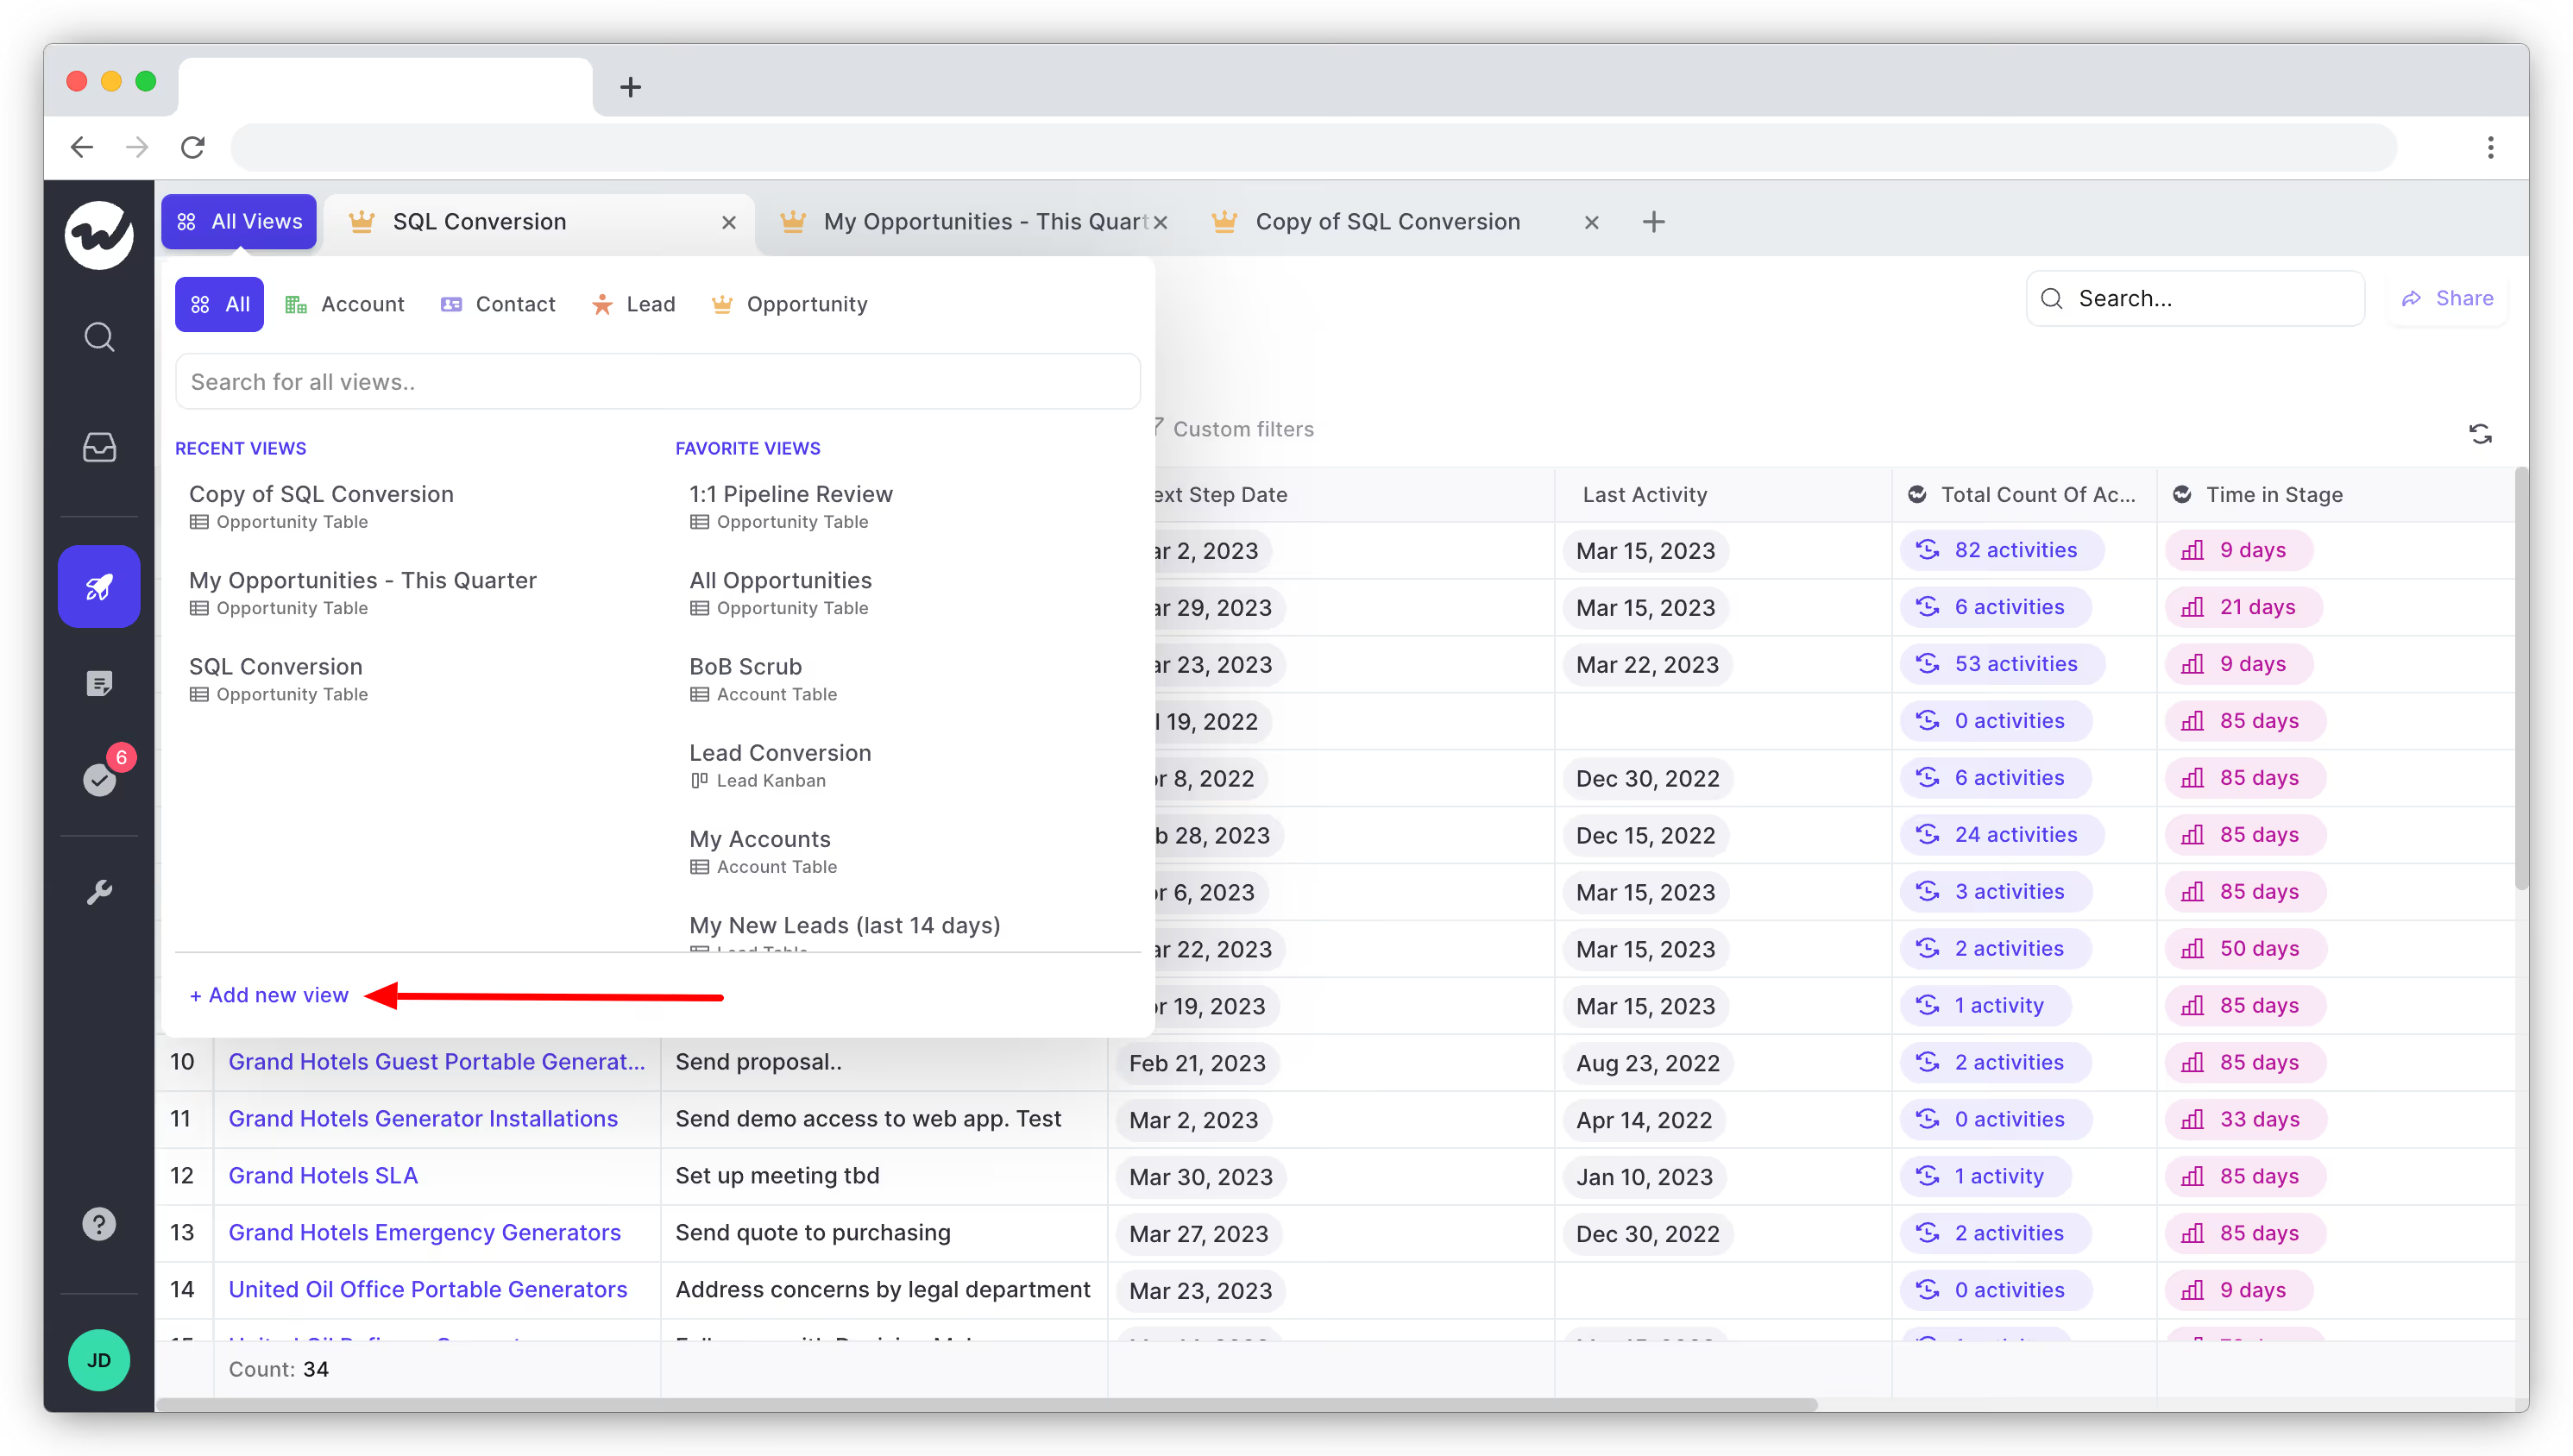
Pick a layout for your view. You can go for the standard table view or a more visual Kanban layout. Choose the record type that you want to see, and don’t forget to add a name.
You’ll then have a custom view of data generated from Salesforce. You can keep customizing the view by adding or hiding fields, as well as filtering the available data using custom filters.
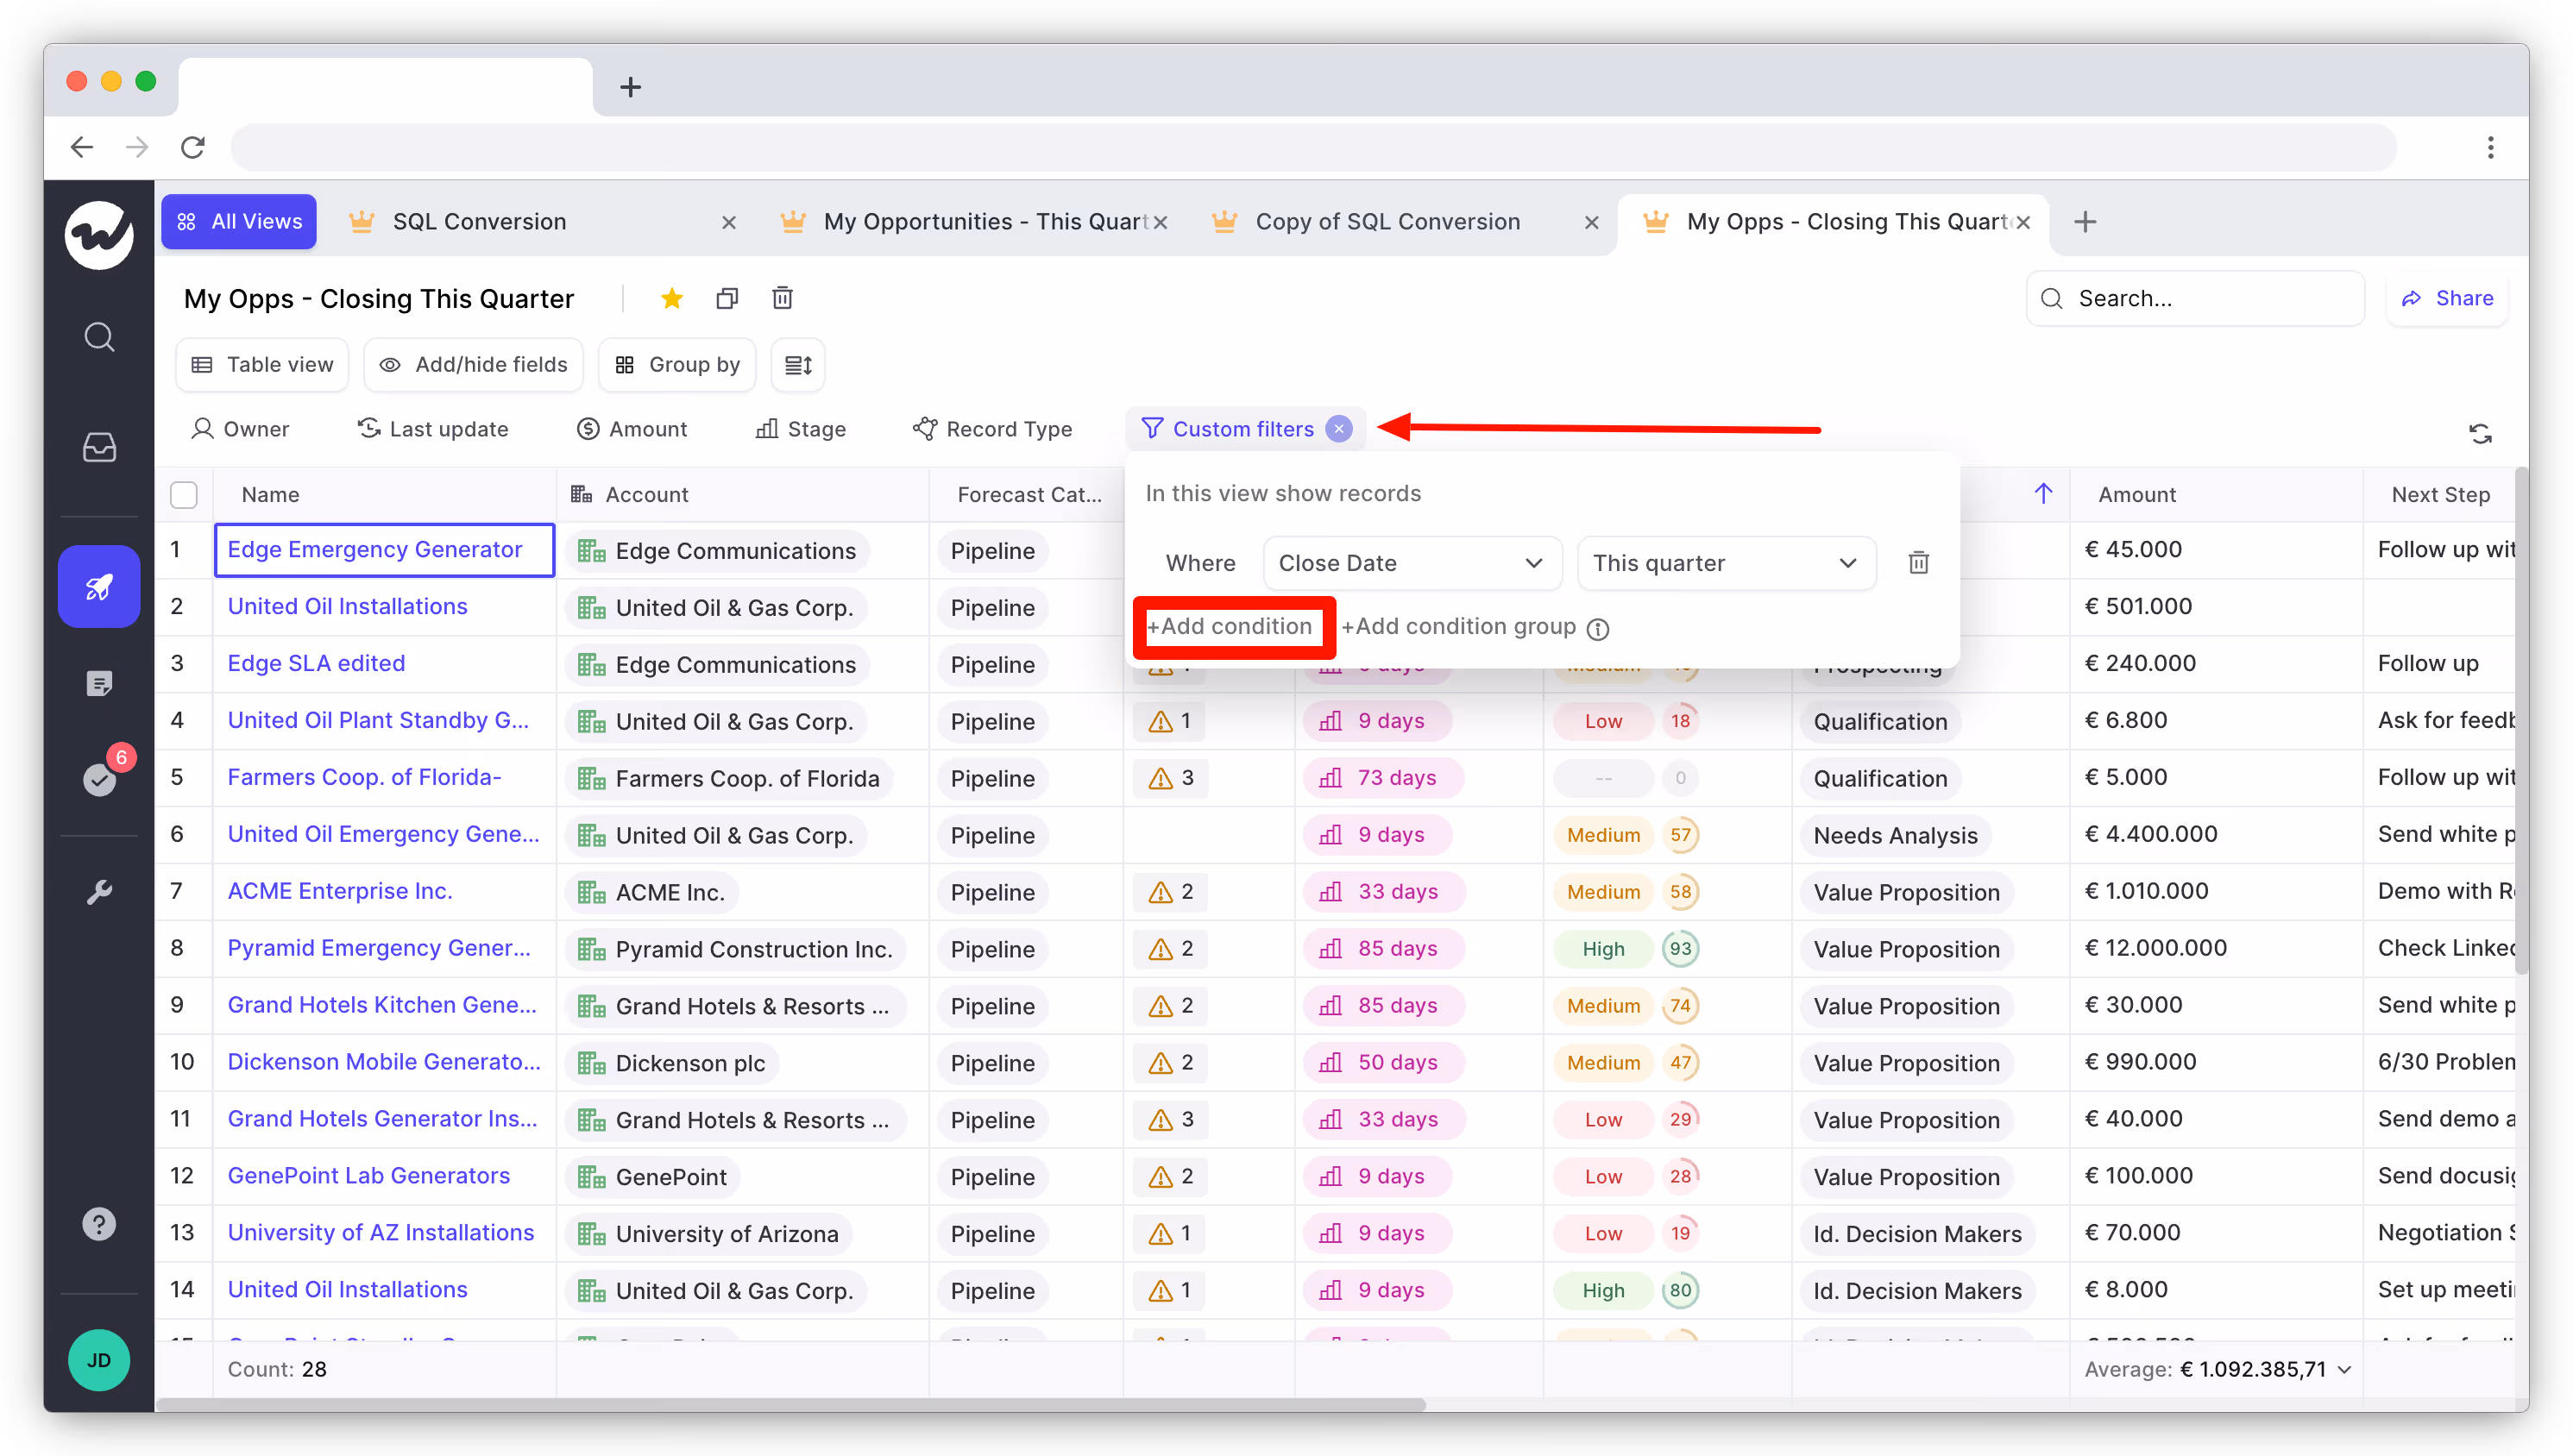
With this, you can quickly narrow down the information you need to generate your report and weed out extraneous information.
Frequently asked questions about creating Salesforce reports
In this section, we’ve answered some of the most frequently asked questions about creating Salesforce reports.
How many types of reports are there in Salesforce?
There are four main types of reports that you can create in Salesforce — tabular, summary, matrix, and joined reports.
What is the difference between Salesforce reports and dashboards?
Reports and dashboards are two different ways of presenting data in Salesforce. Reports show the raw data, while dashboards summarize the information in a graphical format so that you can quickly scan it for insights.
Both are useful tools to have in your toolkit as they allow you to view and analyze multiple sets of data at once.
How to schedule a report in Salesforce?
Select the report you want to schedule and click the Schedule button. You can then set up the recurrence (daily, weekly, monthly, etc.) and enter an email address to send the report to.
How to subscribe to a Salesforce report?
Go into the report you want to subscribe to and click Subscribe. You can then enter an email address and schedule how often you want to receive the report (daily, weekly, monthly, etc.).
How to share a report in Salesforce?
Select the report you want to share and click Share. You can then enter the email addresses of people you want to share the report with and select their permission level (view only, edit, etc.). You can also add an expiration date for when the shared link will no longer be valid.
How to export Salesforce reports to Excel?
Click the report you want to export and click the Export button. You can then select Excel as your file format, and the report will be downloaded in .xlsx format. From there, you can open it with any spreadsheet software (such as Microsoft Excel or Google Sheets).
How to place a Salesforce report on a dashboard?
Simply click Add To Dashboard. You can then select which dashboard you want to add it to, as well as how big you want it to appear. This is an easy way to create a quick overview of your data at a glance.
Wrap up
Now that you understand the different Salesforce report formats and know how to create reports and build a custom report type, it’s time to take action and create your next Salesforce report to analyze your sales data.
Bookmark this page so that you can reference it later in case you get stuck along the way.