As a sales manager, one of your key responsibilities is to keep your sales pipeline healthy. A healthy pipeline means your sales team is consistently generating new leads, closing deals, and hitting sales targets. But, determining sales pipeline health can be a challenge.
In this blog post, we’ll discuss the challenges of determining sales pipeline health, then provide you with three key performance indicators (KPIs) and three questions you should ask to analyze sales pipeline health.
What is sales pipeline health?
Sales pipeline health refers to the number of leads in your pipeline that are likely to convert into customers.
A healthy pipeline means your sales team is generating enough high-quality leads, moving those leads through the pipeline efficiently, and closing deals at a consistent rate.
Challenges with determining sales pipeline health
Some common challenges sales leaders face when determining sales pipeline health are:
- Pipeline bloat – Deals have been sitting in the pipeline for a long time. These could be due to low activity, stagnation at a certain stage, or because the prospect keeps pushing out the close date.
- Pipeline coverage too low – A typical coverage value is 3-4x to hit quota. Anything below this could signal a problem with your pipeline.
- Poor pipeline data hygiene – You have limited visibility into leading and lagging indicators of pipeline health. It could be fine, or it could be dangerously unhealthy—the problem here is not knowing.
3 KPIs to track sales pipeline health
Use these key performance indicators (KPIs) to track sales pipeline health:
1. Pipeline coverage ratio
Your pipeline coverage ratio is the ratio of the value of all deals in the pipeline to the sales target. A healthy pipeline coverage ratio is typically 3-4x to hit quota.
The formula for calculating it is as follows:
Pipeline coverage ratio = Total value of your sales pipeline / Your sales target
For example, if you have $1,000,000 worth of opportunities in your pipeline, and your sales target is $250,000, you have a 4x pipeline coverage ratio and a healthy pipeline.
If your target is $500,000, however, then you’re only at a 2x pipeline coverage ratio and at risk of not meeting your quota.
Sounds simple enough, right? Unfortunately, this metric is not without its flaws, and therefore, not always accurate. Here are a few issues with using pipeline coverage ratio:
- Pipeline value represents seller’s hope more than it does the actual buyer intention.
- The true deal value may not be accurately reflected. For example, a large number of low-value deals could skew the ratio and make it appear as though the pipeline is stronger than it actually is.
- Blended segments may obscure the normal distribution of your deals. For example, if sales data from multiple regions are merged together, it may hide the fact that a particular product is only selling well within a specific region.
These flaws can lead to an over-inflated pipeline that’s actually way off. And if your pipeline’s off, your pipeline coverage ratio math will be too.
By now, you might be thinking, “If this metric is so flawed, why would anyone use it?” Great question. Pipeline coverage ratio serves as a quick glance at your environment, kind of like looking at a thermostat.
But what if there’s a windchill? Well, that brings us to our next metric — adjusted pipeline coverage ratio.
2. Adjusted pipeline coverage ratio
The adjusted pipeline coverage ratio takes into account the probability of deals closing based on their stage in the sales cycle. This KPI reports a more accurate picture of your pipeline health than the pipeline cover ratio alone.
To address the flaws of the pipeline coverage ratio, the adjusted pipeline coverage ratio does the following:
- Determines the probability of each deal closing based on its stage in the sales process, historical win rates, and other relevant factors.
- Factors in the estimated deal value for individual deals in the pipeline for a more accurate picture of the total potential revenue.
- Segments the pipeline into different categories based on things like product type, customer size, or sales rep. This provides a more granular analysis of the pipeline and provides insights into where improvements can be made.
Calculating the adjusted pipeline coverage ratio requires a bit more homework, but the improved accuracy is worth it. Here’s the formula:
Adjusted pipeline coverage ratio = Total weighted pipeline value / Target pipeline value
Here’s how to find the values you’ll need to plug into this formula:
Total weighted pipeline value
Follow these steps to get your total weighted pipeline value:
Step 1: Segment your pipeline. Segmentation could be based on product type, customer size, sales rep, or other factors.
Step 2: Assign a probability of each deal closing. This value could be based on historical win rates and other relevant data. For example, a deal in the early stages of the sales process may have a lower probability of closing than a deal in the final stages.
Step 3: Multiply the probability of each deal closing by its estimated deal value. This is the weighted pipeline value for each segment.
Step 4: Add up the weighted pipeline values for each segment. This is your total weighted pipeline value.
Here’s an example: you have a deal still in the early stages of the sales process that you’ve assigned a 3 out of 10 for the probability of closing. The estimated value of the deal is $50,000.
3 x $50,000 = a weighted pipeline value of $150,000. Let’s pretend you do this for every deal across all your segments and get a grand total weighted pipeline value of $5,000,000.
Target pipeline value
You’ll determine the target pipeline value based on your sales goals and historical conversion rates. This is the amount of pipeline value you need to achieve your sales targets.
Example: For the last two years, your pipeline value has grown each quarter by about 5%. Last quarter, your pipeline value was $1,000,000. This quarter, a safe target pipeline value would be $1,050,000.
Now, let’s plug the two examples above into our adjusted pipeline coverage formula:
Adjusted pipeline coverage ratio = $5,000,000 / $1,050,000 = 4.76x
Now that’s a healthy pipeline!
3. Pipeline hygiene score
The pipeline hygiene score is a measure of the quality of your pipeline data. A healthy pipeline hygiene score means that you have accurate, up-to-date data on every deal in your pipeline. Here are steps to calculate your pipeline hygiene score:
Step 1: Define the criteria for a healthy pipeline. This could include factors like deal quality, opportunity age, deal size, stage progression, and win rates.
Step 2: Assign scores for each criterion. For example, you may assign a score of 0-10 for deal quality based on factors such as the prospect's fit, their level of interest, and the strength of their buying authority.
Step 3: Weight the scores. For example, deal quality may be weighted more heavily than opportunity age if the quality of the deals in the pipeline is more important in driving sales.
Step 4: Calculate the total score. Scores x Weights = pipeline hygiene score.
Step 5: Evaluate the score. This could be based on your own historical data or, if that’s not available, industry benchmarks. For example, a score of 80% or higher may indicate a healthy pipeline, while a score of less than 50% may indicate a need for urgent attention and improvement to your sales strategy.
Step 6: Identify areas for improvement. Identify the criteria where the score is low and analyze to find the underlying causes. For example, if the deal quality score is low, you may need to re-evaluate your lead generation strategy or qualification process.
3 Questions you should ask to determine sales pipeline health
Sales managers can ask these three questions to determine sales pipeline health:
1. What’s the shape of your sales pipeline?
A healthy sales pipeline has the shape of a funnel—wide at the top (where most opportunities are located) and narrow at the bottom (with deals that are nearing their close dates).
A common indicator of poor sales pipeline health is too many deals being stuck in the middle stages with no clear next steps or commitment from the customer to move forward.
Measuring deal quality is an important factor here. Are most sales reps just filling up the top of the sales funnel with low-quality prospects to seemingly increase pipeline coverage, only to find that they won't convert down the line?
Organizations should develop objective qualification criteria for each stage and assign appropriate probabilities—and make these visible in their CRM.
You can streamline pipeline review by using a tool like Weflow. It allows you to create custom pipeline views to get the data you need to determine the health of your sales pipeline.
Here’s how to create a custom pipeline view in Weflow:
Log in to Weflow, click on Pipeline in the left-hand menu, and then on +Add new view.
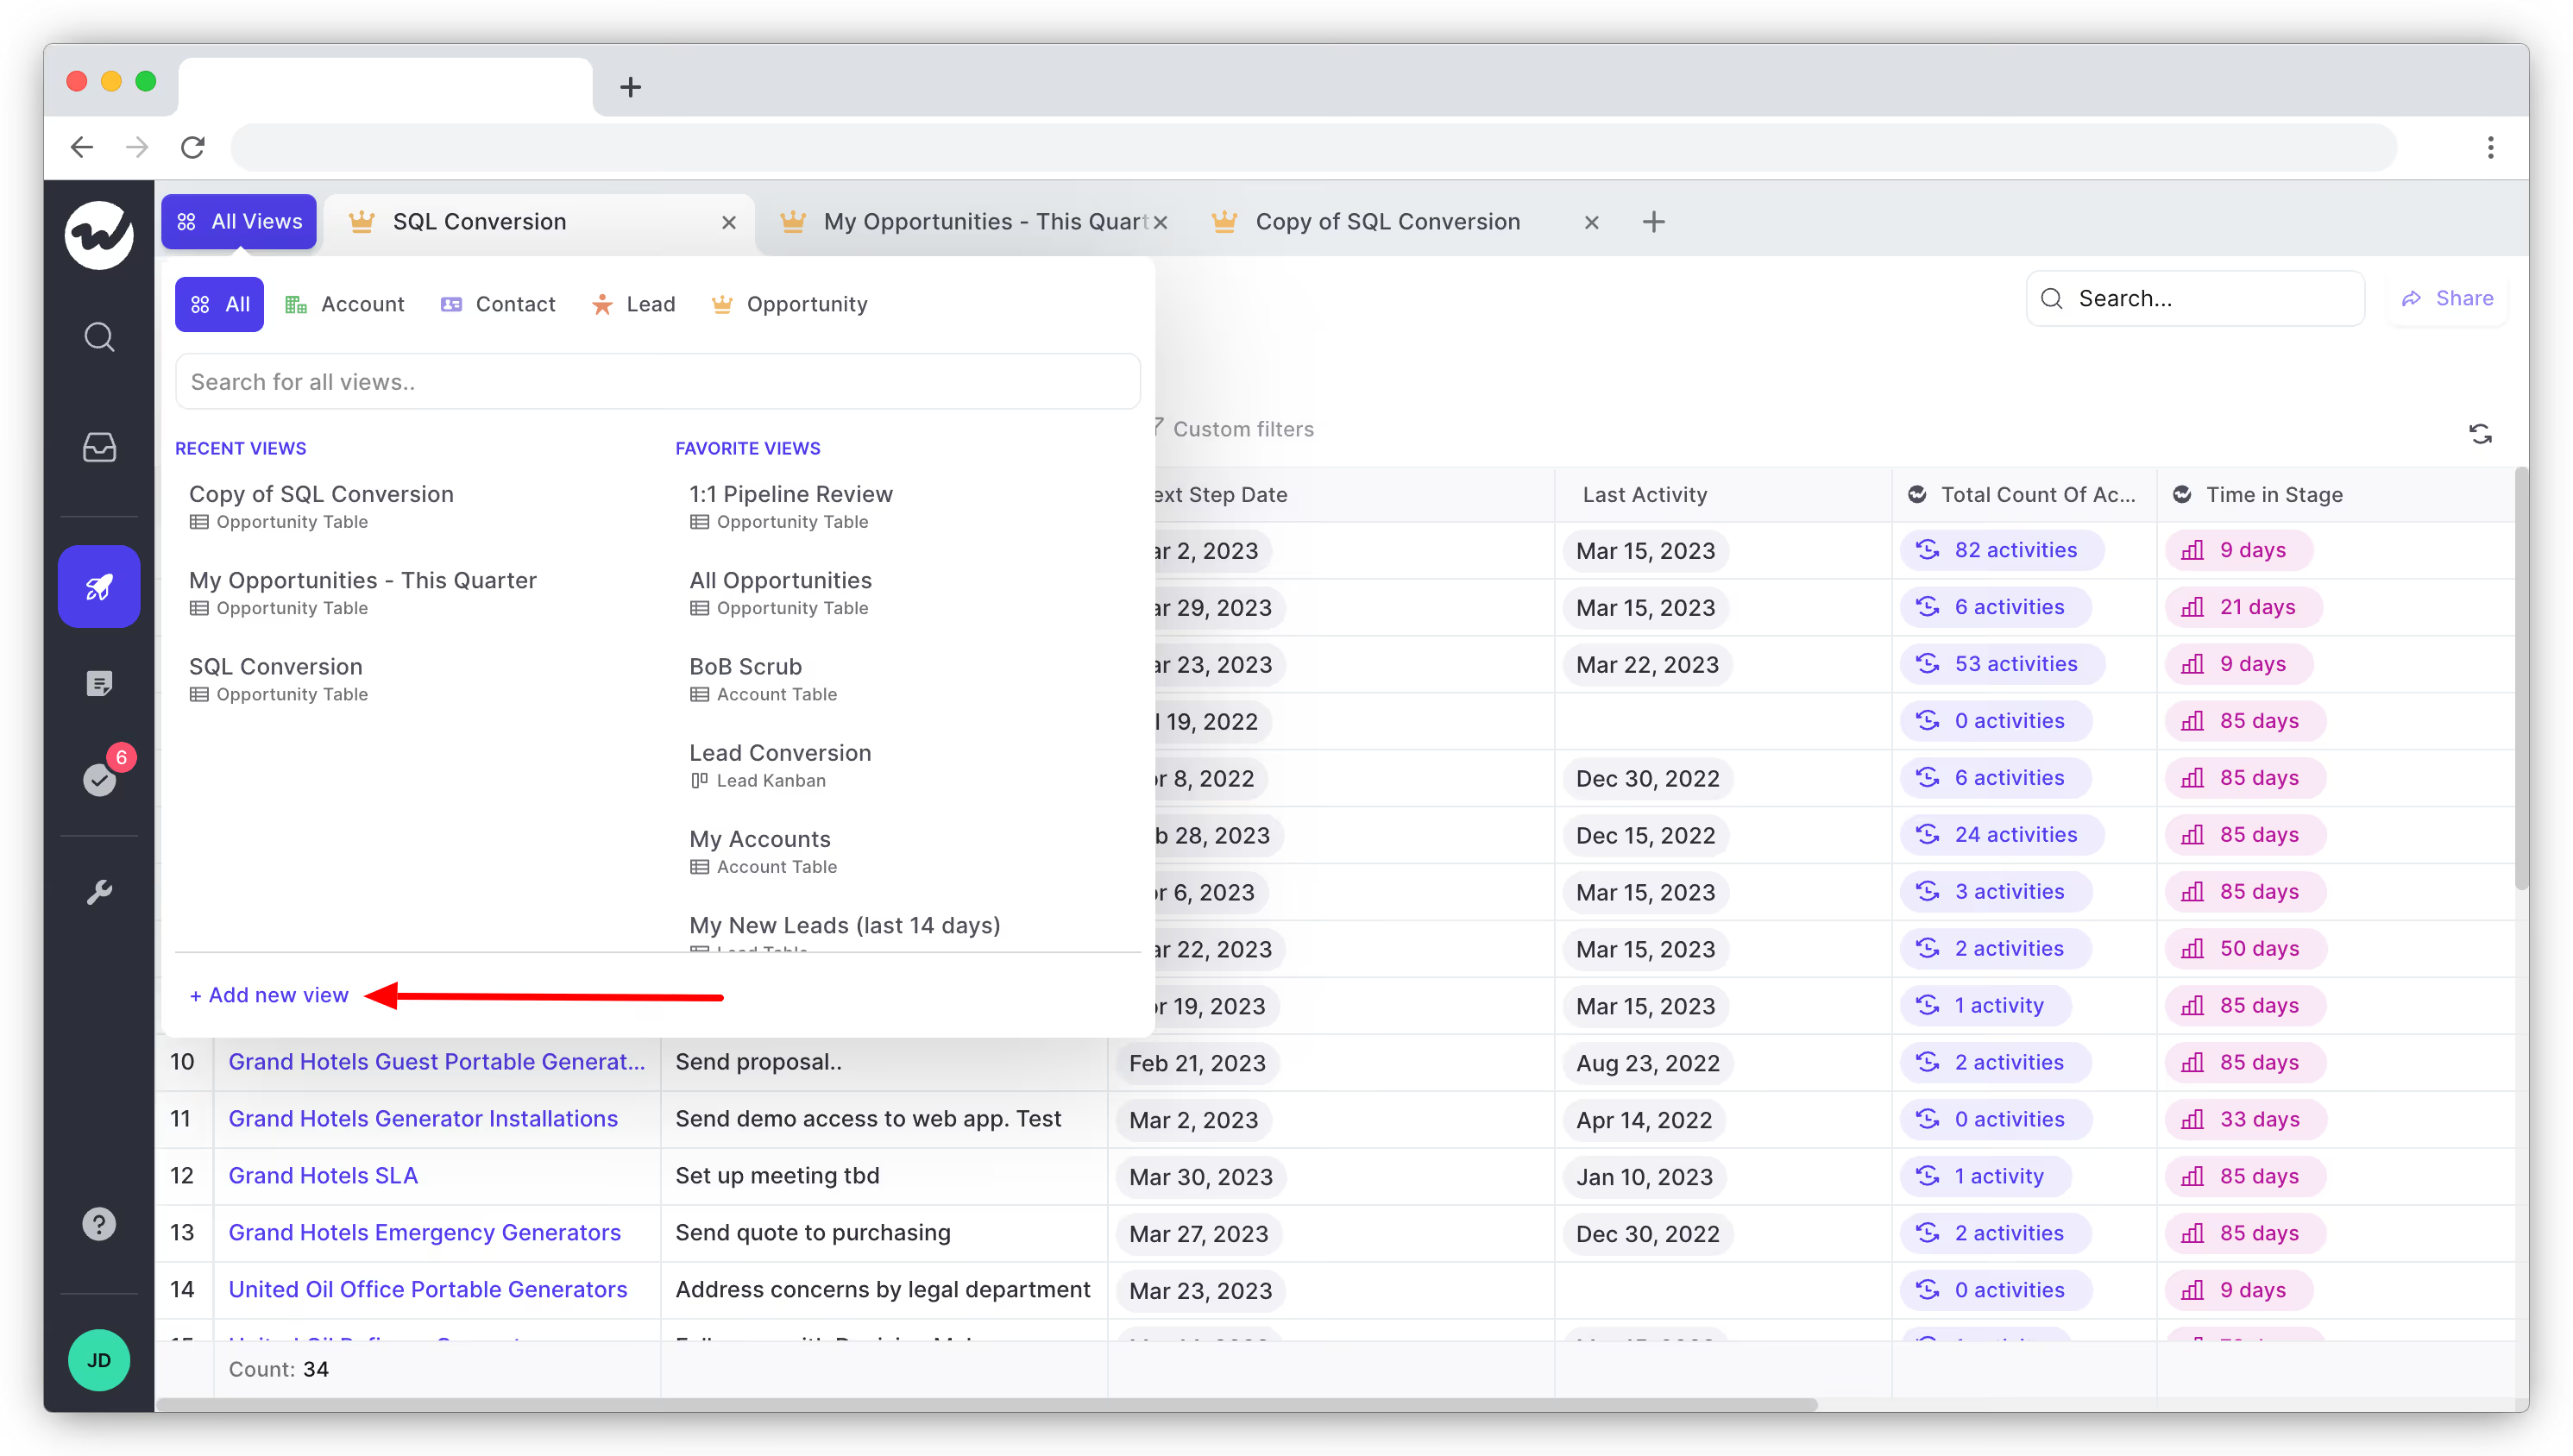
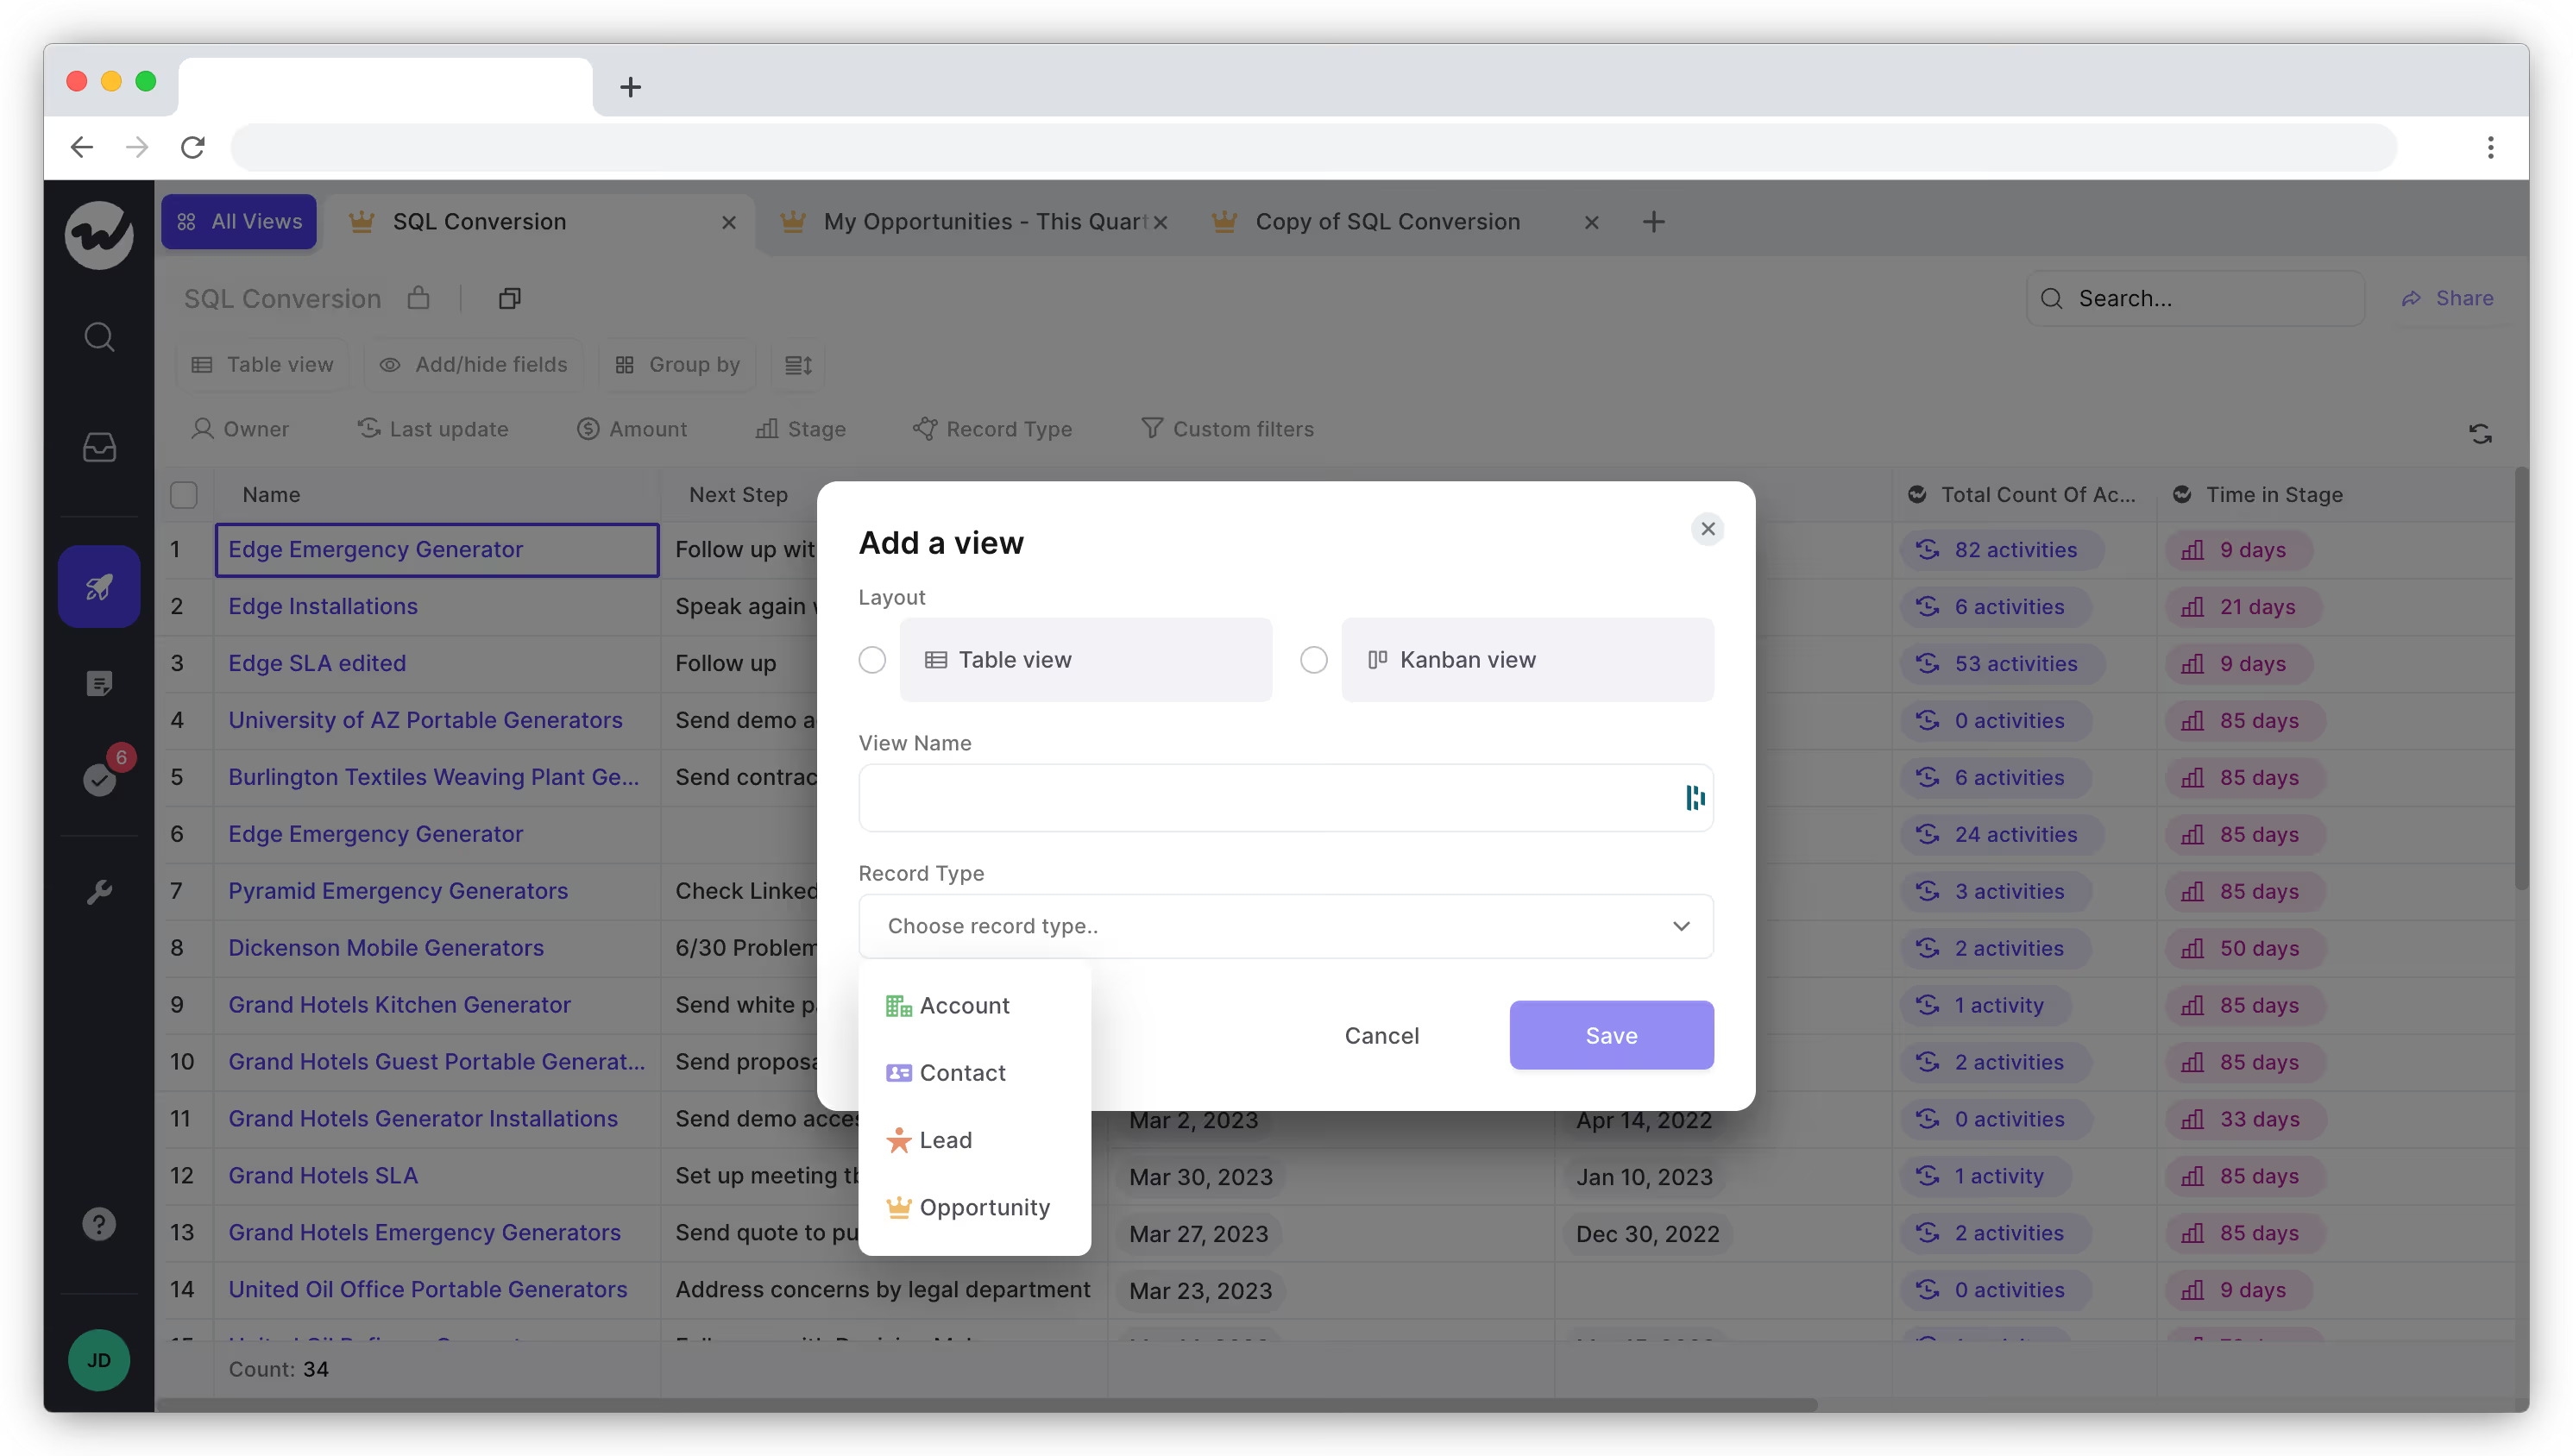
Choose a layout for your pipeline view (table or Kanban), add a name, and select from the available record types.
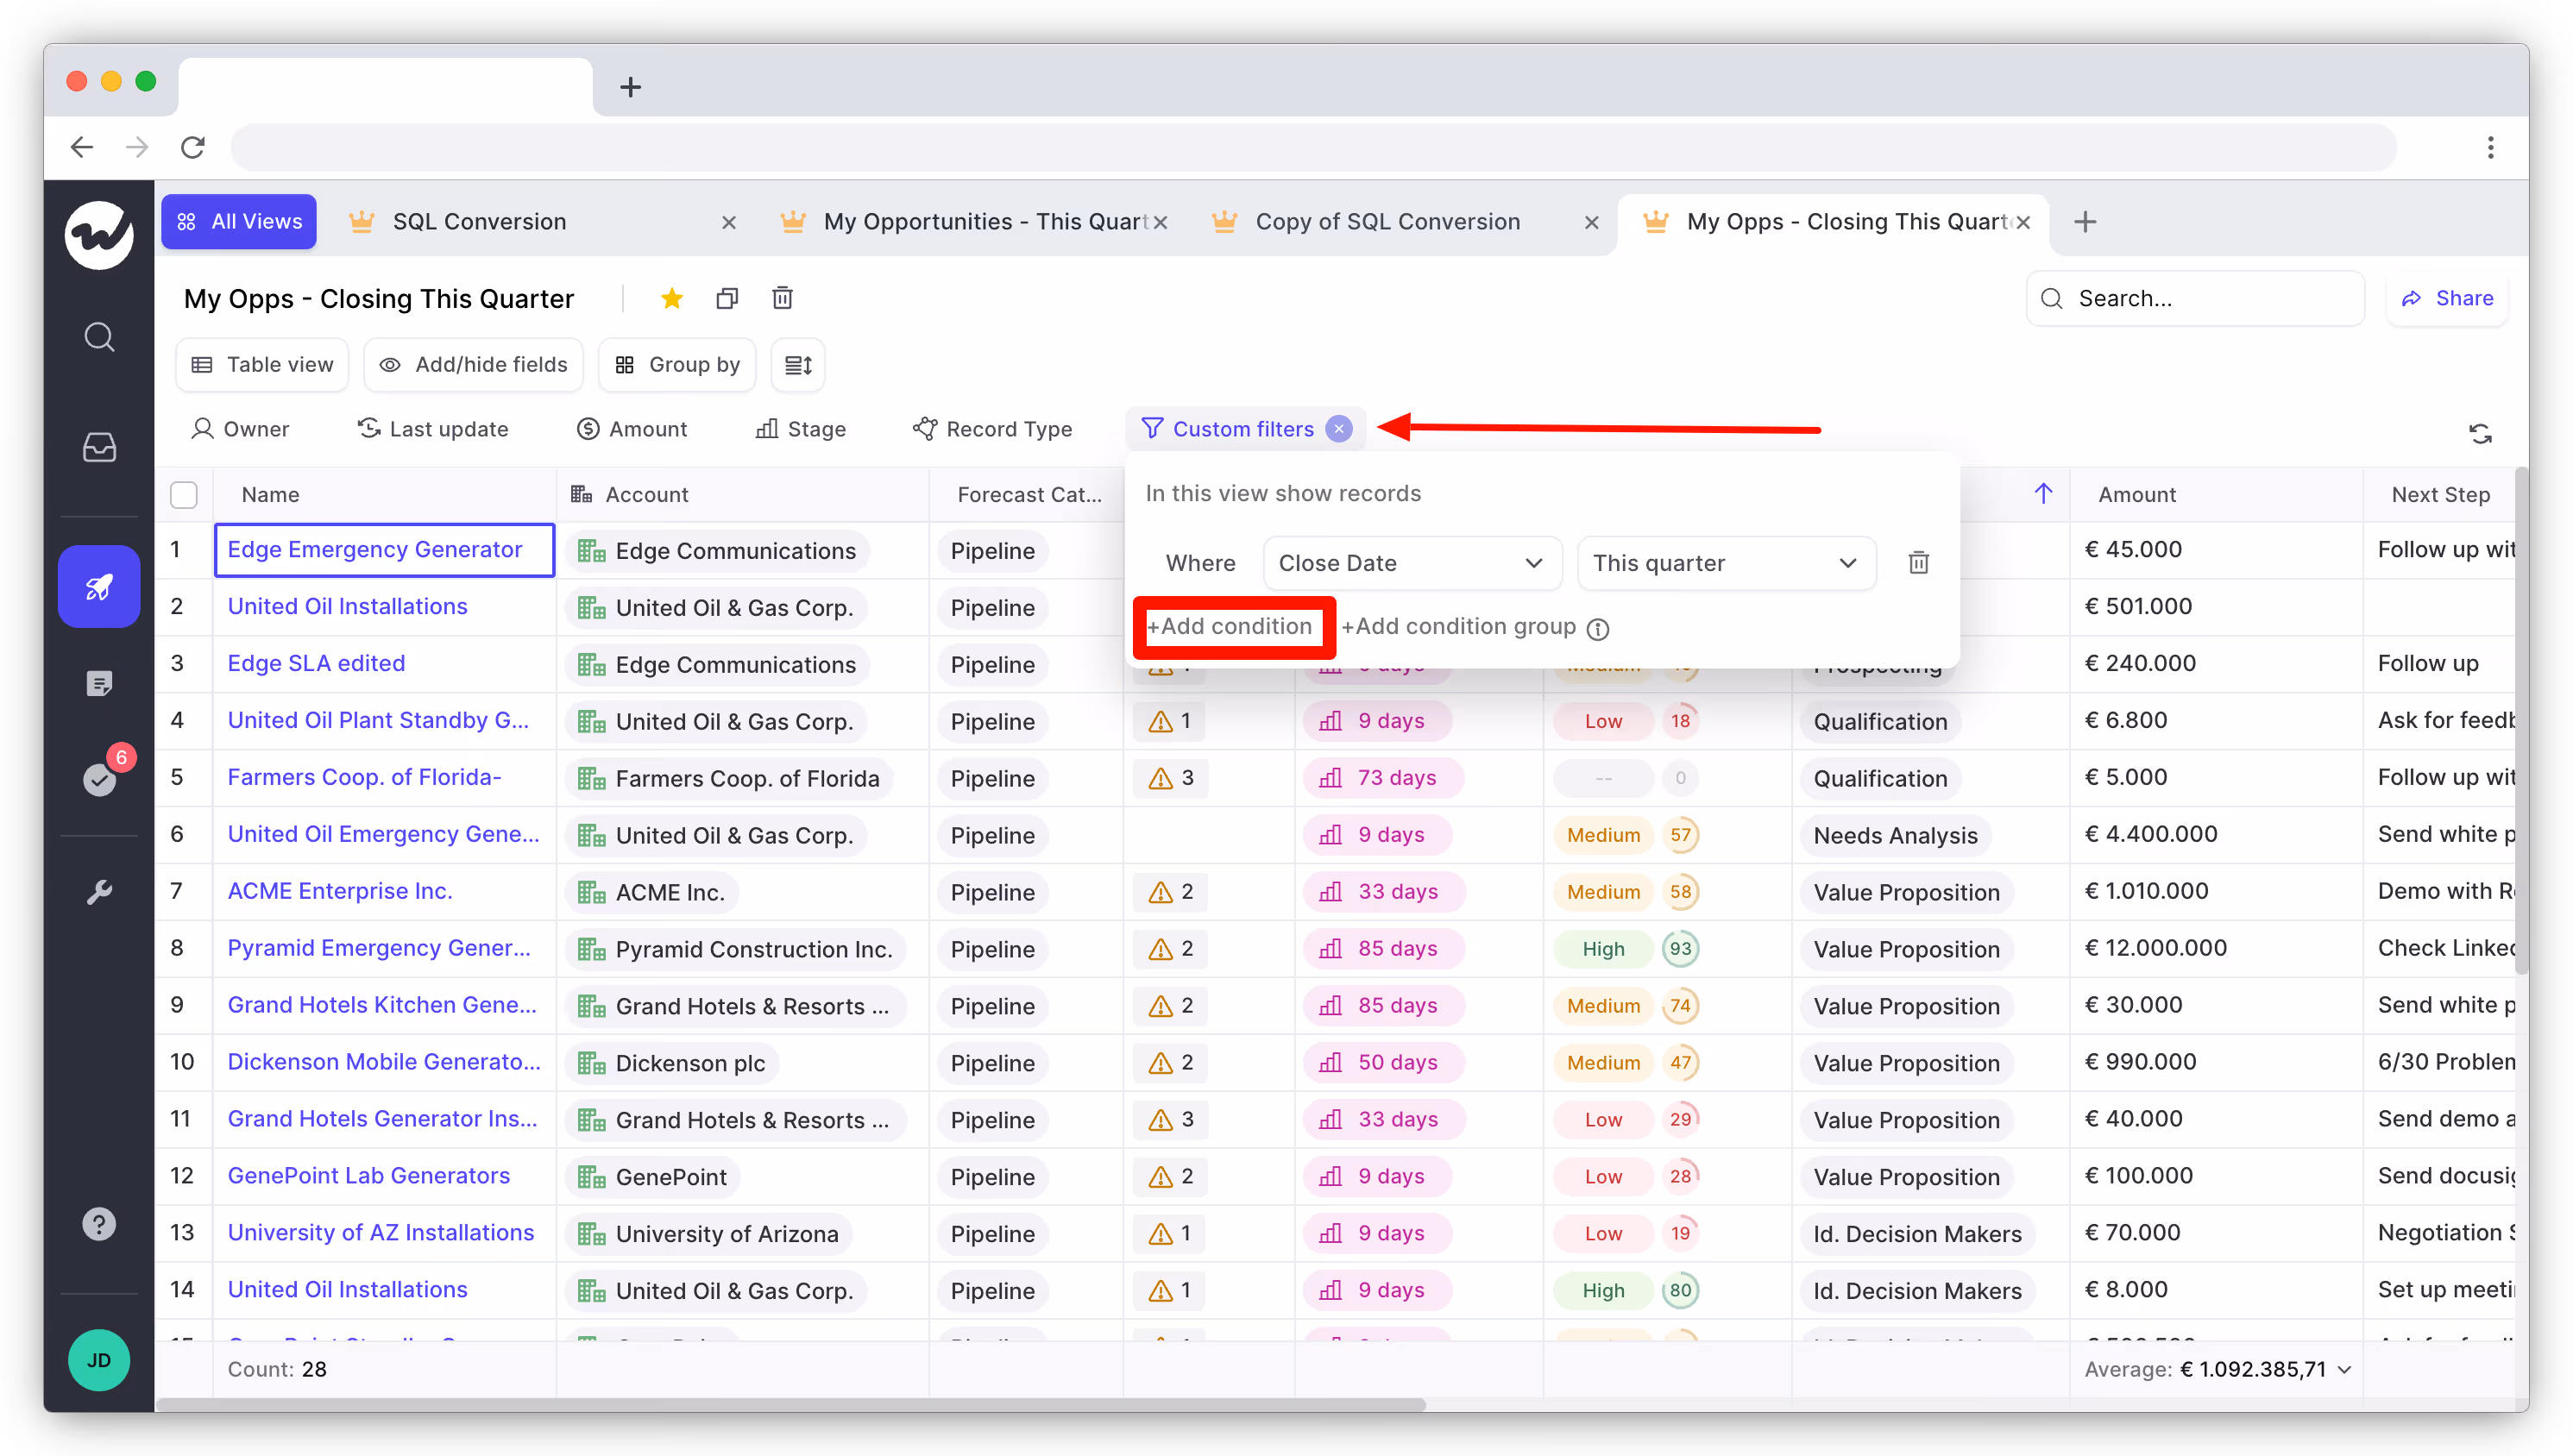
Weflow will now generate a custom pipeline view using data from your Salesforce CRM instance. You can then customize the view further with the help of filters or by adding or hiding fields.
2. Is your pipeline growing at a rate that supports your sales targets?
Growth is an important part of sales pipeline health. To keep your pipeline healthy, you’ll want to ensure that your team keeps prospecting regularly and doesn’t just focus on closing deals in progress.
“Keep your sales pipeline full by prospecting continuously. Always have more people to see than you have time to see them.” — Brian Tracy, Chairman and CEO of Brian Tracy International
Pipeline coverage does not need to be 400% (or 300%, whatever it may be) for the entire year, as long as you’re constantly adding to your pipeline. This is called pipeline generation and should be a regular effort sprinkled throughout each week or month.
3. How quickly are deals moving through the pipeline?
Also known as sales velocity, the speed at which deals are moving through your pipeline is crucial for pipeline health. The faster prospects move through the pipeline, the quicker you can close deals and generate revenue.
Sales velocity is influenced by several factors, including:
- Pipeline size – The larger your pipeline, the more potential revenue you have in play.
- Average deal size – The larger the average deal size, the more revenue you can generate from each closed deal.
- Win rate – The win rate measures the percentage of deals that your team is closing successfully.
- Sales cycle length – The length of your sales cycle determines how quickly you can close deals and generate revenue.
To calculate your sales velocity, you can use the following formula:
Sales velocity = (Number of opportunities × Deal value × Win rate) / Average sales cycle length
By tracking your sales velocity over time, you can identify trends and make data-driven decisions to improve sales performance.
For example, if your sales velocity is decreasing, you could make the decision to ensure your sales team focuses on improving win rates or shortening the sales cycle to generate revenue more quickly.
Keep your sales pipeline in check
Managing a healthy sales pipeline is crucial for the success of any business. By leveraging the KPIs and questions outlined in this guide, you can ensure your sales pipeline stays healthy at all times.
.webp)
.webp)