Pipeline Visibility in Salesforce: Automate Data Capture, Flag Risk, and Track Forecasts [Step-by-Step]
Pipeline visibility in Salesforce breaks down when opportunity data is late, incomplete, or trapped outside the CRM. If your managers are inspecting deals with missing activity, vague next steps, and stale close dates, your forecast is already off.
This guide shows how to fix that step by step: automate data capture, inspect deal health with clear signals, analyze pipeline trends, and run a forecast cadence your CRO can trust. The focus is practical Salesforce execution—not theory.
CRM data automation: build a foundation for accurate forecasting
Forecast accuracy starts with input quality. If emails, meetings, notes, qualification data, and key opportunity fields don’t make it into Salesforce reliably, your deal reviews turn into detective work and your forecast call turns into opinion.
Most reps don’t avoid CRM updates because they’re careless. They avoid them because manual data entry is slow, repetitive, and usually happens after the real work is done—after a call, between meetings, or late on Friday. That’s why manual logging creates activity gaps, bad field hygiene, and incomplete buying committee data. The fix is to move capture as close to the source as possible—email, calendar, call recordings, and meeting summaries—and write it back to Salesforce automatically.
This is also why some RevOps leaders replace Gong with Weflow, a Salesforce-native revenue AI platform, instead of adding another system. Gong is strong in conversation intelligence, but teams often run into shallow field mapping, manual workarounds, and activity gaps in Salesforce. Weflow is built to write back activity, notes, methodology fields, and forecast signals directly into Salesforce with a lower integration footprint—deployed in weeks, not quarters.
Sync activity data to reveal buying committee engagement
If activity data depends on rep memory, it won’t be complete. The result is familiar: a manager opens an opportunity record before a forecast call and sees two logged meetings, while the account actually had 14 emails, a pricing review, and a security discussion that never made it into Salesforce.
- Auto-capture emails and meetings from Google Workspace or Microsoft 365 so open opportunities reflect real account activity without rep logging.
- Map activities directly to Salesforce opportunities, accounts, and contacts so managers can inspect deal momentum in the right record context.
- Improve activity completeness by reducing missed interactions, especially on high-volume reps and multi-contact deals.
- Expose buying committee coverage by showing which stakeholders are engaged, how often, and through which channel.
- Let reps review and correct attribution in Gmail, Outlook, or calendar workflows so Salesforce write-back stays accurate without admin cleanup later.
- Give managers a usable deal timeline instead of a partial one assembled from Slack pings and rep memory.
A simple example: a manager flagged a deal as “ghosted” because no recent activity appeared on the opportunity. Once email sync was in place, the team could see an active thread with procurement and legal from the previous three days. The deal wasn’t stalled—the CRM was.
Record meeting notes to improve Salesforce hygiene
| Problem | Manual process | AI-assisted Salesforce workflow |
|---|---|---|
| Critical deal context gets lost after calls | Reps type partial notes, paste them into Slack, or skip logging entirely | Meetings are recorded, transcribed, summarized, and synced to the related Salesforce record |
| Notes vary by rep | One rep logs objections, another logs nothing, a third adds a one-line summary | Standard summaries capture pain points, blockers, next steps, competitors, and timeline in a consistent format |
| Managers spend time hunting for context | They ask reps to retell the call or read scattered notes across tools | They review one summary and jump to the transcript or recording only when needed |
| Handoffs are messy | SDRs, AEs, and CS teams piece together history from separate systems | Salesforce becomes the shared record of the conversation, not just the deal metadata |
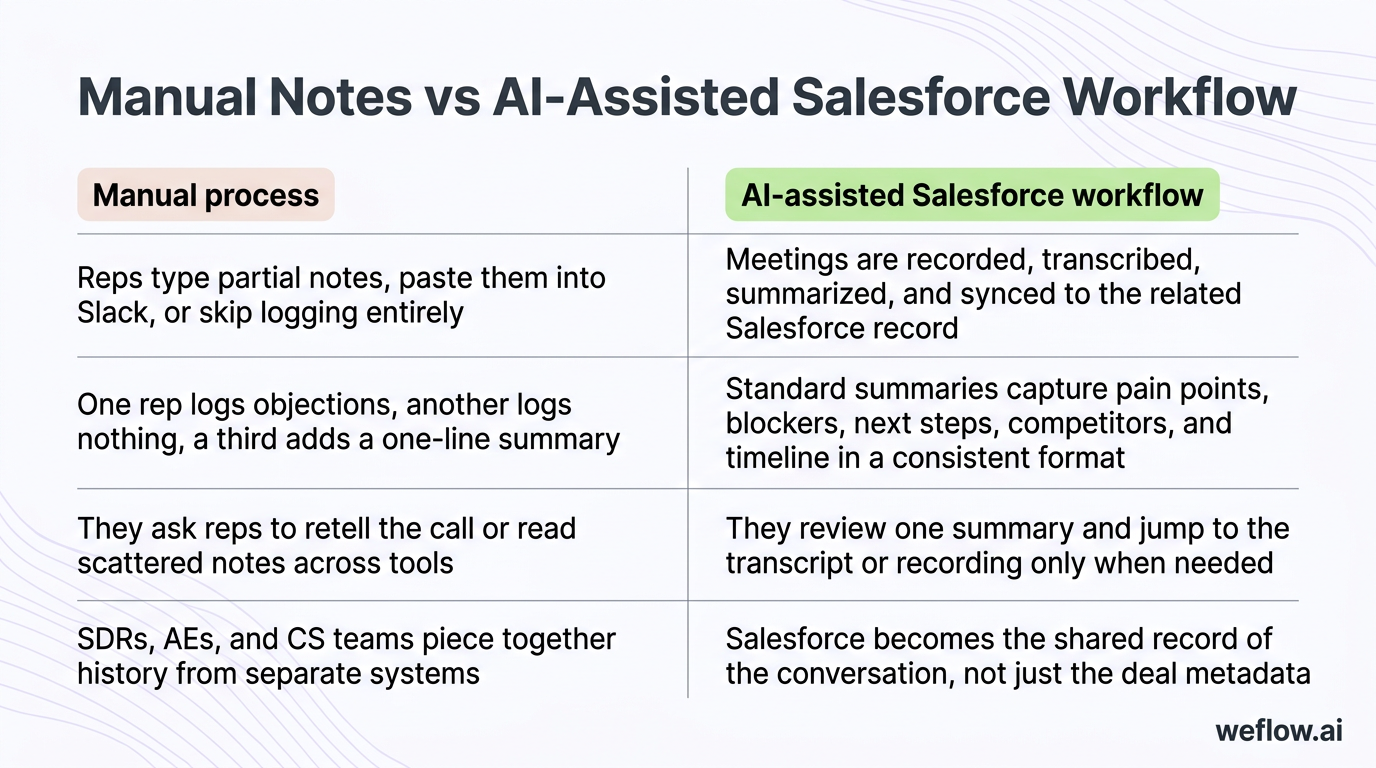
Manual note-taking looks cheap until you count the time lost and the quality issues it creates. Standardized notes also make SDR-to-AE and AE-to-CS handoffs much cleaner, because each team sees the same customer context in Salesforce instead of relying on personal note styles.
Map sales methodology fields to qualify real deals
Qualification frameworks help you separate pipeline that looks active from pipeline that can actually close. MEDDIC usually tracks elements like metrics, economic buyer, decision criteria, decision process, identify pain, and champion. SPICED focuses on situation, pain, impact, critical event, and decision. Even if you use a homegrown framework, the rule is the same: the methodology only helps if it lives in Salesforce as structured data.
- Decide where the data belongs. Put methodology fields on the Opportunity if they drive inspection and forecasting there. Use Account or custom objects only when the data needs to persist across multiple deals.
- Create field templates for your framework. Define the exact Salesforce fields you want populated—economic buyer identified, champion strength, critical event date, pain summary, decision process, and so on.
- Use AI prompts against meeting transcripts. Pull likely methodology answers from recorded calls instead of asking reps to rewrite the conversation into fields later.
- Write the data back to Salesforce with field-level rules. That includes mapping to the correct opportunity, contact, or related record.
- Add a human review step for sensitive fields. Reps or managers should confirm high-impact updates like economic buyer status or critical event timing.
- Report on completeness and quality. Don’t just track whether the fields exist—track whether they’re recent enough to trust in forecast reviews.
This is where teams often outgrow Gong. Capturing the conversation is useful, but if the output doesn’t flow into Salesforce fields cleanly, RevOps still ends up doing manual workarounds to make methodology reporting usable.
Enforce stage exit criteria to capture key CRM fields
Stages should do more than describe pipeline. They should enforce the minimum data needed to inspect the deal and roll it into a forecast. If a rep can move an opportunity to Proposal or Negotiation without updating the basics, your pipeline view will drift away from reality.
- Stage: current sales stage must reflect the actual buyer motion, not rep optimism.
- Amount: use the latest scoped value, not an early placeholder.
- Close date: tie it to a real customer event or commitment.
- Products: if your motion depends on product mix, line items or product selections need to be complete.
- Forecast category: automate where possible so commit, best case, and pipeline aren’t left to inconsistent rep judgment.
- Next step or next meeting date: not always required by default, but often worth enforcing for inspection.
- Qualification fields: require the minimum methodology data once a deal passes early discovery.
Salesforce tip: use validation rules tied to StageName changes to block advancement when required fields are blank. For example, if an opportunity moves to Proposal and Amount, CloseDate, Primary Product, or Next_Step__c is empty, Salesforce should stop the save and tell the rep exactly what’s missing. In Salesforce Enterprise and Unlimited, this is one of the lowest-effort ways to improve pipeline hygiene fast.
Deal health inspection: identify risks before opportunities stall
Once your Salesforce data is complete enough to trust, you can inspect deal health with more than gut feel. That’s the shift from the first section to this one: clean data makes real deal inspection possible. Without that foundation, every warning signal is noisy.
Define clear next steps to prevent stalled opportunities
Deals slip when the “next step” is vague, internal-only, or not tied to a buyer commitment. A future commitment should be specific, scheduled, and mutual.
- Group demo scheduled with identified stakeholders and a confirmed date
- Trial onboarding scheduled with owner, timeline, and success criteria
- Security review scheduled with the customer’s security team and required documentation sent
- Legal redline review scheduled with both sides introduced
- Pricing review scheduled with procurement or finance involved
- Executive alignment call scheduled with the sponsor and internal sales leadership
A weak next step is “following up next week.” A strong next step is “legal redline review scheduled for Tuesday at 2 p.m. with procurement and outside counsel.” One creates motion. The other creates hope.
Track activity velocity to measure buyer urgency
Key velocity metrics to watch on every open opportunity:
- Emails sent and received in the last seven, 14, and 30 days
- Meetings completed and meetings scheduled
- Two-way engagement rate, not just outbound rep touches
- Time since last customer response
- Document exchanges such as security questionnaires, pricing files, or redlines
- Days in current stage compared with your segment benchmark
High activity doesn’t always mean a healthy deal—an endless security loop can create a lot of noise without real progress. But low activity is almost always a problem, especially late in the quarter. If the customer isn’t investing time, they’re not treating the deal as urgent.
Verify multi-threading to build a base of influencers
Single-threaded deals are fragile. If all activity runs through one contact, the deal can disappear with one reorg, one vacation, or one champion who loses influence.
Key takeaway: most mid-market and enterprise B2B SaaS deals involve six to 10 stakeholders, so a deal with one active contact is under-threaded by default. Use Salesforce contact roles, activity history, and meeting participation to check whether you’ve built a real base of influencers and champions.
Confirm access to power to engage key decision-makers
| Recommender | Approver |
|---|---|
| Uses the product or owns the workflow problem | Controls budget, signing authority, or final approval |
| Can advocate for your solution internally | Can stop the purchase even if the team likes the solution |
| Often appears early in calls and discovery | Often appears later unless the rep asks for access directly |
| Should be visible in Salesforce as an engaged contact | Must be visible in Salesforce as a named stakeholder before commit |
A quick way for reps to ask for access to power without sidelining their champion is: “To keep your timeline on track, who else should we include before legal and budget review?” It respects the current contact while making the approval path explicit.
Review communication context with AI deal summaries
Strong metrics can still create false confidence. A deal may show recent activity, multiple contacts, and a scheduled next meeting while the actual email thread reveals procurement resistance or a missing security answer. AI deal summaries help managers get the context fast by condensing recent calls, notes, and emails into one view. That can save hours during weekly 1:1s because managers spend less time reconstructing the deal and more time coaching the next move.
Configure pipeline views to flag warnings and signals
You can’t inspect every deal manually at scale. Pipeline views in Salesforce should surface the accounts that need attention first.
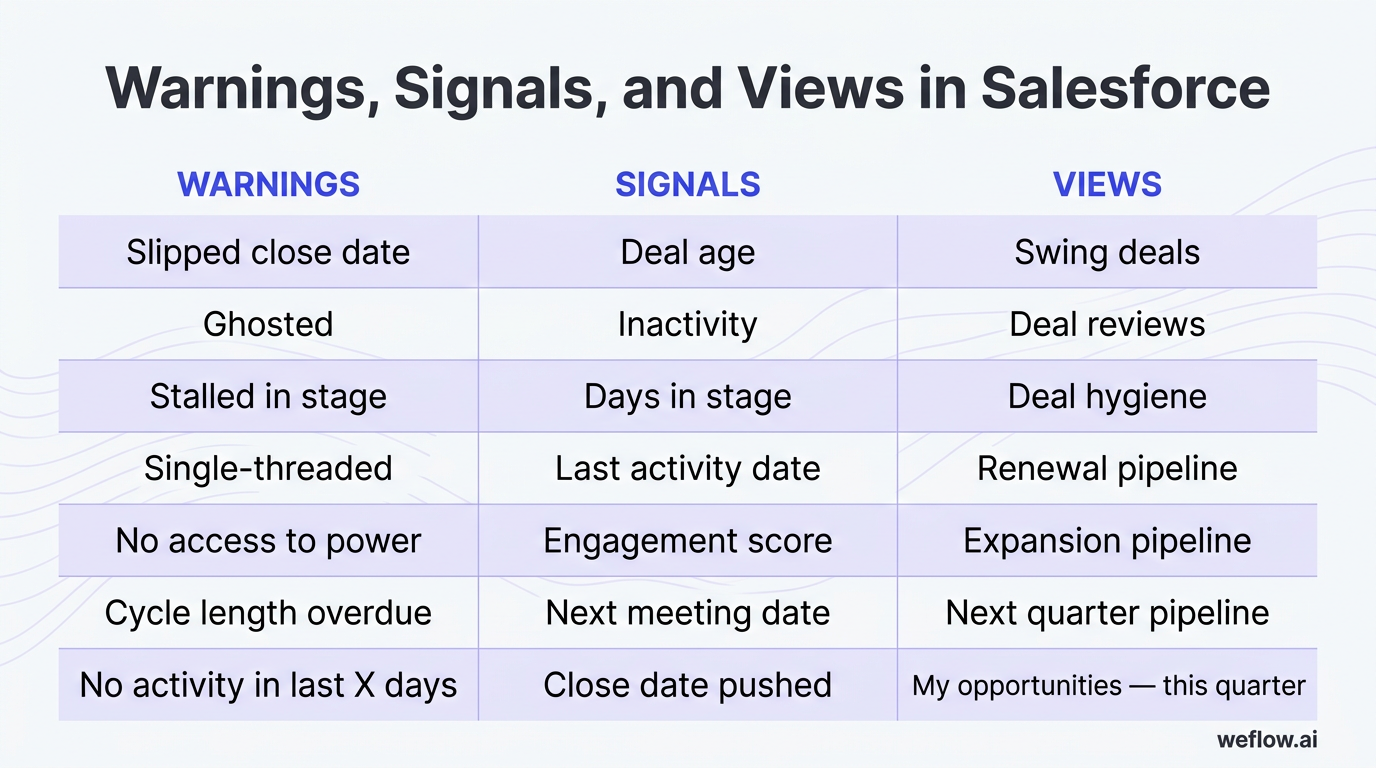
| Warnings | Signals | Views |
|---|---|---|
| Slipped close date | Deal age | Swing deals |
| Ghosted | Inactivity | Deal reviews |
| Stalled in stage | Days in stage | Deal hygiene |
| Single-threaded | Last activity date | Renewal pipeline |
| No access to power | Engagement score | Expansion pipeline |
| Cycle length overdue | Next meeting date | Next quarter pipeline |
| No activity in last X days | Close date pushed | My opportunities — this quarter |
Basic Salesforce setup for a “Stalled Deal” list view: create an Opportunity list view filtered to open opportunities where LastActivityDate is older than 14 days, StageName is not Closed Won or Closed Lost, and CloseDate is in the current or next quarter. Add columns for owner, amount, days in stage, next step, and next meeting date. If you want tighter control, pair the view with a report subscription or a custom warning field updated through automation.
Pipeline health analytics: spot revenue gaps and sales trends
Deal health is micro: should this opportunity close, slip, or be removed? Pipeline health is macro: do we have enough quality pipeline by segment, stage, and timing to hit the number? You need both. Good deal inspection helps reps and managers. Good pipeline analytics help RevOps, marketing, and sales leadership adjust before the quarter is gone.
- Pipeline value and pacing by quarter, segment, geo, and forecast category
- Pipeline waterfall movement including new opportunities, expansions, pull-ins, slips, and amount changes
- Stage conversion rates to locate revenue leakage between stages
- Overall win rate by team, segment, source, and product
- Pipeline coverage ratio against quota or bookings target
- Opportunity creation volume by channel and team
- Sales cycle length by segment, geo, and rep
Monitor pipeline value and pacing across segments
Pacing tells you whether pipeline generation is tracking toward the quarter target or falling behind. In Salesforce, review pipeline value over time by segment, geo, stage, and forecast category so you can see where the shortfall starts. This matters beyond sales leadership—if enterprise pipeline is pacing behind plan by week five, marketing and outbound teams can still adjust campaigns, targeting, or SDR capacity before the quarter is locked.
Analyze pipeline waterfalls to track opportunity changes
A pipeline snapshot shows where you are. A waterfall shows how you got there. That difference matters because most quarter risk comes from movement, not the static number on one day.
- Starting pipeline at the beginning of the period
- New opportunities created during the period
- Amount increases on existing opportunities
- Amount decreases on existing opportunities
- Pulled-in deals that moved into the period
- Slipped deals that moved out of the period
- Closed won and closed lost movement
- Ending pipeline after all changes
Static snapshots are weaker because they hide the reason the number changed. A waterfall shows whether your quarter improved because of real new pipeline, late-stage amount inflation, or a few pulled-in deals that create risk in the next period.
Measure stage conversion to identify revenue leakage
Stage conversion formula: stage conversion rate = opportunities that moved from Stage A to Stage B ÷ total opportunities that entered Stage A during the same period.
If you see high drop-off after Demo, that usually points to a qualification issue, a weak presentation of value, or the wrong stakeholders attending early meetings. If the leak is later—say Proposal to Negotiation—you may be dealing with pricing, procurement, product fit, or a missing economic buyer. The point of conversion reporting is not just to measure loss. It’s to locate where the fix belongs.
Track pipeline coverage to ensure revenue goal attainment
- Coverage ratio: total qualified pipeline for the period ÷ quota or bookings target for the same period.
- Coverage by segment: run the ratio separately for enterprise, mid-market, SMB, or any motion with different win rates.
- Coverage by source: compare inbound, outbound, partner, expansion, and self-sourced opportunities.
- Coverage by stage mix: 4x early-stage pipeline is not the same as 4x late-stage pipeline.
- Sales cycle length: longer cycle segments need earlier pipeline creation to support the same target.
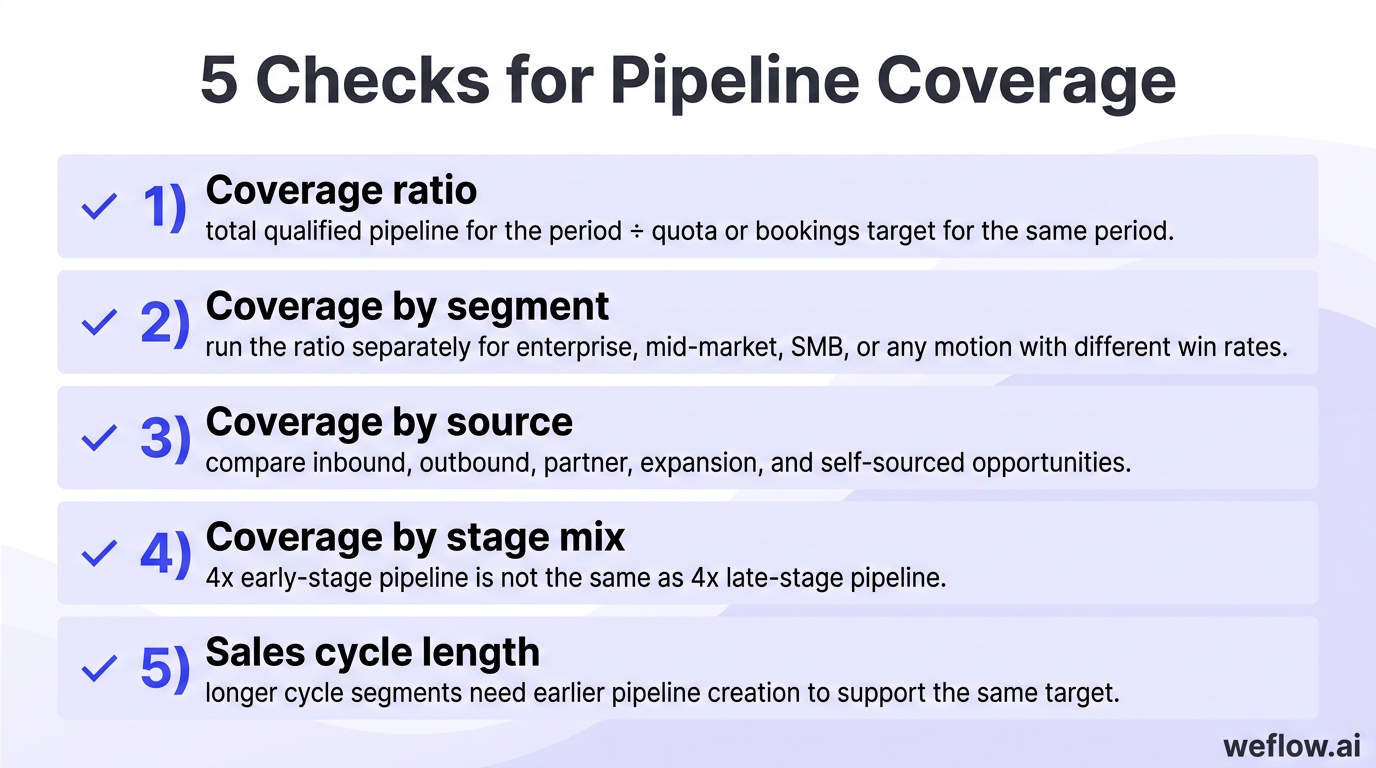
The common baseline is 3x to 4x pipeline coverage, but the right number depends on your win rate, sales cycle, stage definitions, and how much of the quarter’s target must come from new logo versus expansion or renewals. Teams with weaker conversion rates or late pipeline generation often need more than 4x. Teams with short cycles and tight qualification may need less.
Sales forecasting methods: project revenue with higher accuracy
Most mature revenue organizations don’t rely on one forecasting method. They blend low-effort models, manager judgment, and historical pattern analysis to get a number that’s accurate enough to run the business. The right mix depends on data quality, forecast discipline, and how much process overhead the org can handle.
Calculate dynamic weighted forecasts for low-effort tracking
Weighted forecasting is the fastest place to start. You multiply the deal amount by a stage probability or forecast category probability and sum the result across opportunities. It’s simple, but it only works if stage hygiene is real.
| Stage | Example probability | $100,000 opportunity contribution |
|---|---|---|
| Discovery | 10% | $10,000 |
| Demo | 20% | $20,000 |
| Value alignment | 35% | $35,000 |
| Proposal | 60% | $60,000 |
| Negotiation | 90% | $90,000 |
| Closed Won | 100% | $100,000 |
You can weight on stage, forecast category, or a combination of both. The limitation is obvious: if reps move deals forward too early, the model overstates the quarter. That’s the “happy ears” problem—hearing interest, assuming intent, and pushing the deal into a later stage before the buyer has actually made the next commitment.
Run bottom-up forecasts to drive team accountability
Bottom-up forecasting asks reps or managers to submit a call—usually weekly or every other week—based on their view of which deals will close and for how much. It takes more discipline than weighted forecasting, but it usually gives you a better forecast because someone has to own the number.
Pros
- Creates rep and manager accountability for forecast calls
- Lets leaders include or exclude specific deals based on real inspection
- Works well when deal complexity is high and stage-based math is too blunt
- Gives CROs a cleaner view of commit, best case, and upside
Cons
- Breaks down fast without a strict submission cadence
- Depends on clean Salesforce data and disciplined inspection
- Missed submissions and inconsistent manager reviews reduce accuracy
- Spreadsheet-based workflows create version control problems and weak audit trails
This is as much a culture decision as a systems decision. If leaders don’t hold reps and managers accountable for their calls, the process turns into theater instead of forecasting.
Layer AI forecasting to analyze historical deal velocity
AI forecasting adds an objective model on top of human judgment. It looks at historical patterns and current deal behavior to estimate what’s likely to close, then gives leadership a second number to compare against the bottom-up call.
- Historical snapshots of pipeline and forecast changes over time
- Deal velocity including time in stage, response patterns, and progression speed
- Past forecast accuracy by rep and manager
- Close probabilities based on multivariate deal characteristics
- Activity completeness across meetings, emails, and stakeholder engagement
- Stage progression patterns by segment, product, and region
Use AI as a gut check, not a full replacement for manager judgment. If the AI forecast and the bottom-up commit are far apart, that gap is the discussion you want in the forecast meeting.
Operating cadence workflows: align teams on weekly deal reviews
A forecast process only works when everyone knows when to submit, review, adjust, and lock the number. The point of a cadence is predictability. The limit is simple too: if leadership doesn’t enforce deadlines, the rhythm falls apart and every meeting starts with data cleanup instead of decisions.
Establish a weekly forecast submission and review routine
Most teams prefer Thursday or Friday rep submissions so managers and RevOps have current data before Monday leadership reviews. That timing also gives reps one last chance to update late-week deal movement.
| Day | Reps | Managers | RevOps | CRO |
|---|---|---|---|---|
| Monday | Update any late changes from the prior week | Inspect submitted commits, review top deals, adjust calls | Analyze pacing, identify gaps, prepare questions | Review summary views before leadership discussion |
| Tuesday | Answer follow-up questions on flagged deals | Finalize team roll-up and adjustment notes | Validate changes and prepare roll-up views | Review managers’ calls and challenge deltas |
| Wednesday | Execute actions from leadership review | Join forecast meeting with CRO and RevOps | Document actions, risks, and required data fixes | Run forecast meeting and align on company number |
| Thursday | Submit next forecast call | Monitor missing submissions | Send submission and hygiene reminders | Review major changes if needed |
| Friday | Finish updates before lock | Confirm team completeness | Lock submissions, snapshot pipeline, track changes | Hold line on process compliance |
Roll up forecast calls by role hierarchy or territory
Forecast calls need to aggregate cleanly from rep to manager to region to company. The right roll-up path depends on how you run the business—role hierarchy, territory, product line, or a mix. What matters is that adjustments are visible and explained.
| Option | What it handles well | Limitations |
|---|---|---|
| Spreadsheets | Fast to start, flexible for one team, easy to edit manually | Weak track changes, unreliable comments, no durable adjustment history, version control issues |
| Salesforce only | Keeps data in the source system, works for basic reporting and dashboarding | Not built for forecast call submission, manager adjustment notes, or detailed roll-up workflow control |
| Dedicated forecasting software | Supports structured submissions, tracked adjustments, hierarchy roll-ups, and week-over-week change visibility | Requires implementation and process adoption |
Verdict: Dedicated forecasting software wins because it tracks adjustments, roll-ups, and change history in a way spreadsheets and native Salesforce don’t.
Whatever system you use, require adjustment notes. If a manager drops a rep’s commit from $400,000 to $250,000, the CRO needs to know why—slipped security review, lost access to power, reduced scope, or a pushed close date.
Snapshot pipeline data to track week-over-week changes
Without snapshots, pipeline review becomes an argument about memory. A deal disappears, an amount changes, or a close date moves—and nobody can say exactly when it happened or why. That’s how teams end up feeling gaslit by their own pipeline data.
- Number of deals in the pipeline at snapshot time
- Deal amount for each open opportunity
- Forecast category at the time of capture
- Close date and any date movement
- Stage progression between snapshots
- Amount changes up or down
- Deals slipped to next quarter
- Forecast amount by rep, manager, and company roll-up
You can do this with Salesforce reporting snapshots, a database like BigQuery, or forecasting software that stores week-over-week history. The method matters less than the discipline. If you don’t keep a historical record, you can’t explain movement with confidence.
Pipeline visibility next steps: turn CRM data into revenue
Pipeline visibility in Salesforce isn’t a dashboard problem. It’s a data capture, inspection, and operating cadence problem. Clean data gives you visibility, visibility gives you better coaching and forecasts, and automation connects the two without adding more admin work to the field.
This week, audit your current Salesforce instance: pull all open opportunities in the current quarter and check how many are missing a real next step, recent activity, or a named decision-maker. That one report will tell you whether your forecast risk is in the deals—or in the data.
FAQ
How do you improve pipeline visibility in Salesforce?
Start by automating activity capture from email, calendar, and meetings, then enforce stage exit criteria with validation rules so reps can’t advance deals with missing core fields. After that, build list views and reports around next steps, days in stage, and stakeholder coverage so managers can inspect risk fast.
What are the best metrics for assessing deal health?
The strongest deal health indicators are activity velocity, multi-threading, access to power, and a concrete next step with a customer commitment. If you want one more layer, compare days in stage against your benchmark for that segment to separate normal deal timing from actual stall risk.
How does AI improve sales forecasting accuracy?
AI improves forecasting by comparing current deal behavior with historical patterns such as time in stage, engagement changes, stage progression, and past rep forecast accuracy. It’s most useful when it challenges optimistic human calls with an objective probability based on what similar deals actually did.
What is a standard weekly sales forecasting cadence?
A common cadence is: reps submit their forecast late Thursday or Friday, managers inspect and adjust on Monday, and CRO plus RevOps review the roll-up on Tuesday or Wednesday. The missing step many teams forget is snapshotting the pipeline after lock so week-over-week movement is visible and auditable.
.webp)
.webp)