Salesforce includes built-in forecasting tools that let you predict revenue by rep, territory, product family, or custom segment. When they're configured correctly and fed clean data, they give RevOps leaders and CROs a defensible number to bring to the board. When they're not, you get a forecast call where everyone's guessing.
This guide covers every forecast type available in Salesforce, a step-by-step setup walkthrough, and practical ways to improve accuracy—including how Einstein AI fits in. Whether you're setting up forecasting for the first time or cleaning up a configuration that's drifted, you'll find what you need here.
What are the different Salesforce forecast types?
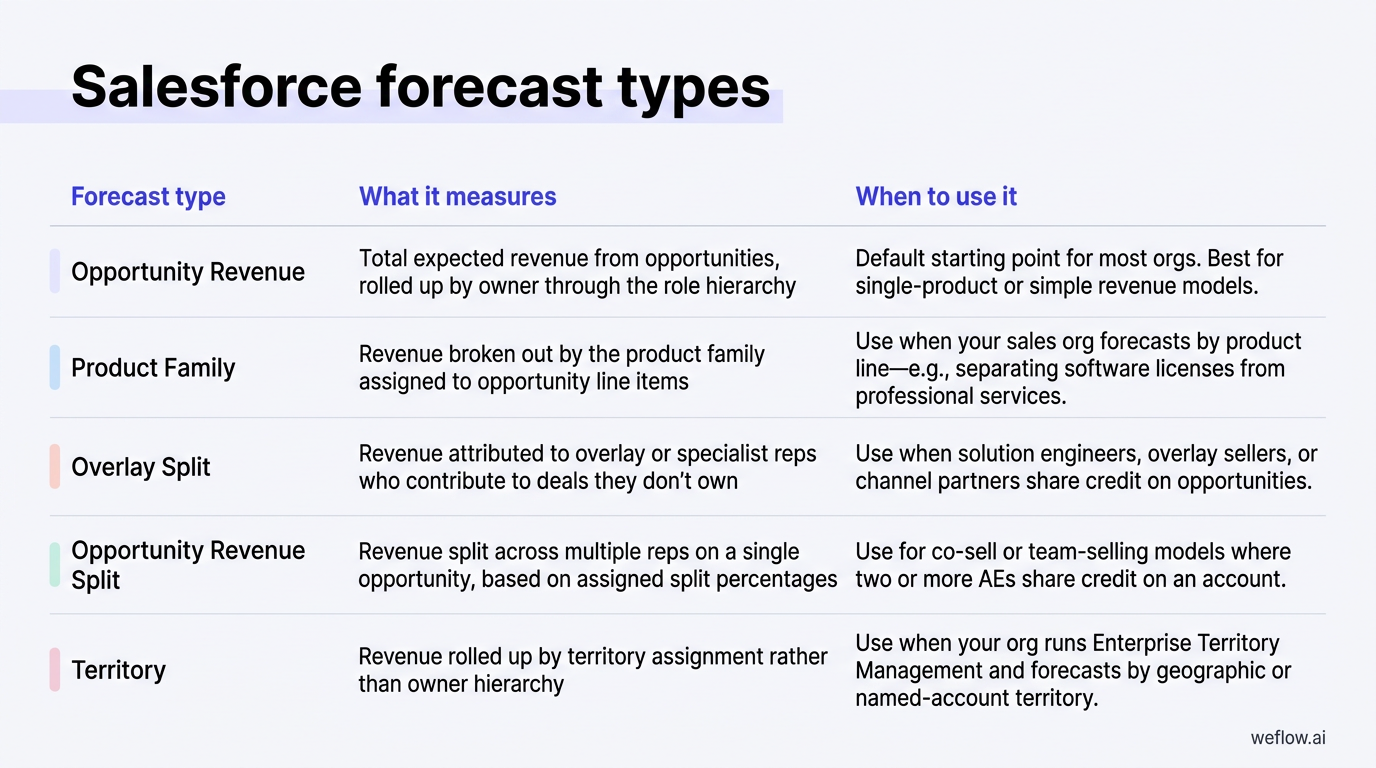
Salesforce supports several forecast types, each measuring a different dimension of your pipeline. You can enable multiple types simultaneously—each appears as its own tab in the Forecasts app.
| Forecast type | What it measures | When to use it |
|---|---|---|
| Opportunity Revenue | Total expected revenue from opportunities, rolled up by owner through the role hierarchy | Default starting point for most orgs. Best for single-product or simple revenue models. |
| Product Family | Revenue broken out by the product family assigned to opportunity line items | Use when your sales org forecasts by product line—e.g., separating software licenses from professional services. |
| Overlay Split | Revenue attributed to overlay or specialist reps who contribute to deals they don't own | Use when solution engineers, overlay sellers, or channel partners share credit on opportunities. |
| Opportunity Revenue Split | Revenue split across multiple reps on a single opportunity, based on assigned split percentages | Use for co-sell or team-selling models where two or more AEs share credit on an account. |
| Territory | Revenue rolled up by territory assignment rather than owner hierarchy | Use when your org runs Enterprise Territory Management and forecasts by geographic or named-account territory. |
A note on segment-based filtering: Salesforce doesn't natively support separate forecast types for new business, renewals, and upsells out of the box—but you can approximate this with custom forecast types tied to a record type or opportunity type field. Many RevOps teams use a custom Opportunity Type picklist (New Business, Renewal, Expansion) and configure separate forecast types or use filters in custom report types to separate these views.
How do Salesforce forecast categories work?
Forecast categories are Salesforce's way of grouping opportunities by the likelihood of closing, independent of pipeline stage. Each opportunity stage maps to a forecast category—and that mapping is what drives how opportunities roll up into a rep's or manager's forecast.
| Category | Definition | Typical stage mapping |
|---|---|---|
| Pipeline | Opportunities that are active but not yet at a confidence level worth committing to | Prospecting, Qualification, Needs Analysis |
| Best Case | Deals that could close if everything goes right—upside to the commit number | Value Proposition, Id. Decision Makers, Perception Analysis |
| Most Likely | Deals the rep expects to close but hasn't fully committed to yet | Proposal/Price Quote, Negotiation/Review (varies by org) |
| Commit | Deals the rep is committing to close this period—their number to the manager | Commit stage (custom), or final negotiation stages |
| Closed | Deals already won (Closed Won) in the current period | Closed Won |
| Omitted | Deals excluded from the forecast—typically Closed Lost or on hold | Closed Lost, Inactive, On Hold |
Managers can adjust the forecast category on any opportunity if they disagree with the rep's assessment—that override appears in the forecast without changing the underlying stage. This is one of the most useful tools for a CRO running a weekly call: you can see where the rep's commit and the manager's judgment diverge.
Salesforce forecast category rollups: single vs. cumulative
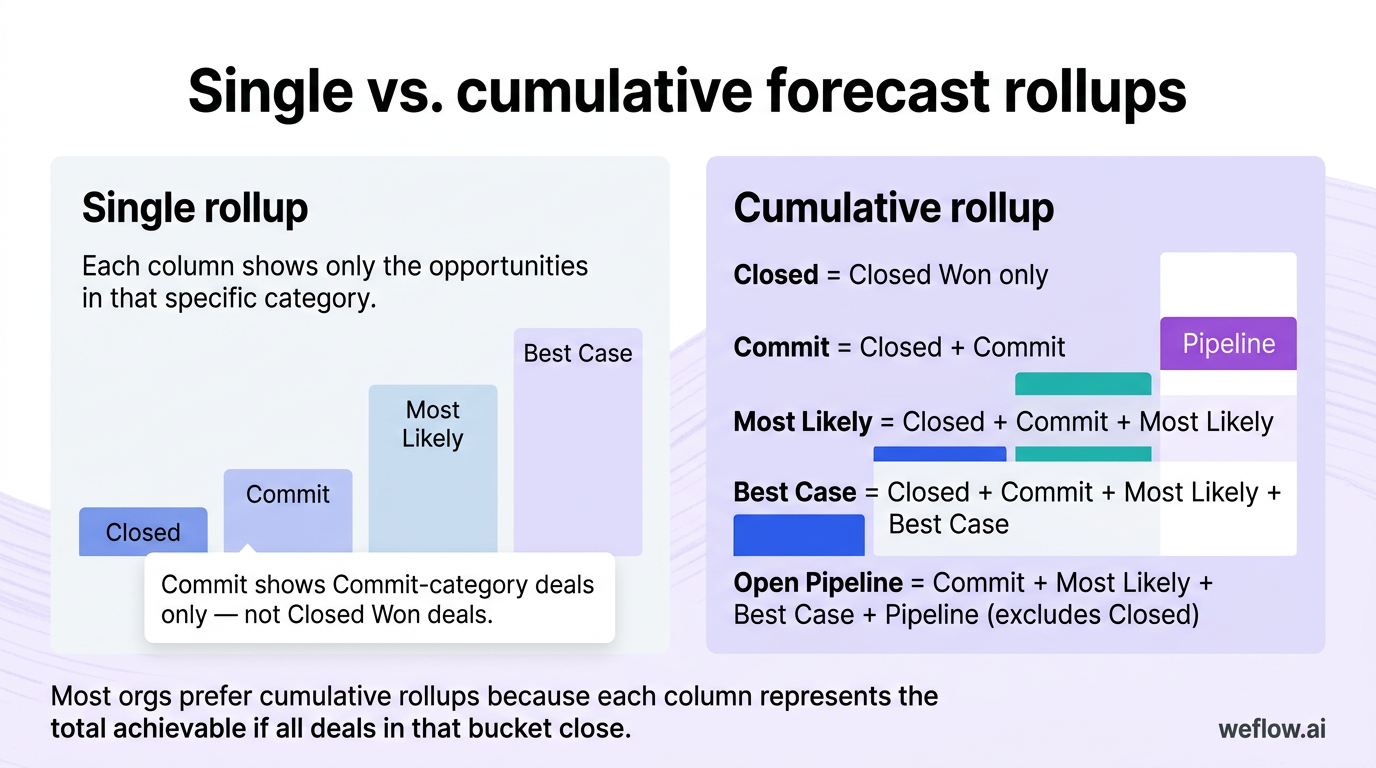
When you configure forecasting, one of the most consequential decisions is whether to use single category or cumulative category rollups. This controls what each forecast column actually includes.
Single rollup: Each column shows only the opportunities in that specific category. If you look at the Commit column, you see Commit-category deals only—not Closed Won deals that also count toward the number. This requires users to add up columns mentally, which creates confusion during forecast calls.
Cumulative rollup: Each column shows that category plus all more-certain categories below it. The Commit column already includes Closed. The Best Case column already includes Closed, Commit, and Most Likely. Most orgs prefer cumulative rollups because the number in each column represents the total achievable if all deals in that bucket close—which is how most CROs think about the forecast.
| Forecast column | What's included (cumulative rollup) |
|---|---|
| Closed | Closed Won only |
| Commit | Closed + Commit |
| Most Likely | Closed + Commit + Most Likely |
| Best Case | Closed + Commit + Most Likely + Best Case |
| Open Pipeline | Commit + Most Likely + Best Case + Pipeline (excludes Closed) |
Note that Open Pipeline in the cumulative model excludes Closed Won—it's your remaining opportunity to hit quota, not your total. This is intentional and is how most sales leaders read pipeline coverage.
How to set up Salesforce forecasting (step-by-step)
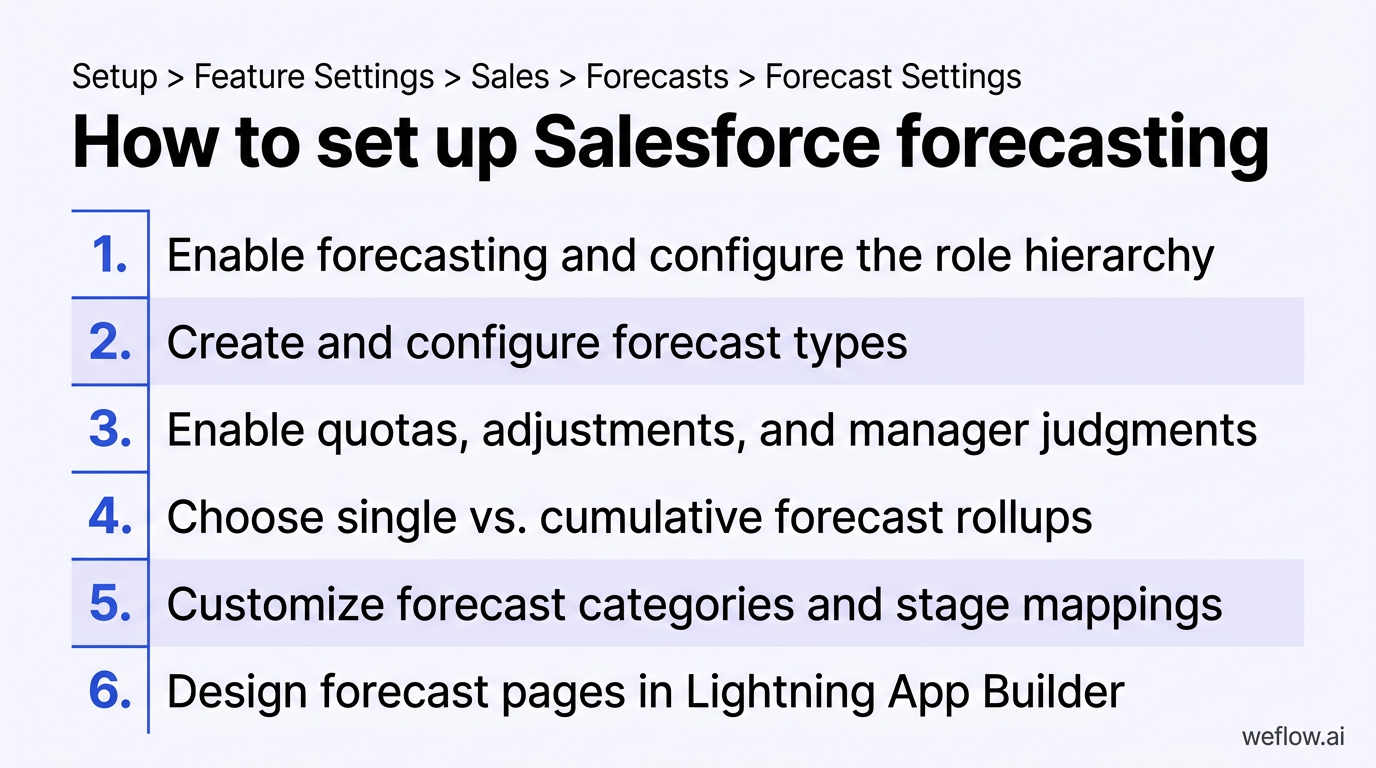
The path to forecasting in Salesforce Lightning is: Setup > Feature Settings > Sales > Forecasts > Forecast Settings. You'll need System Administrator permissions and, if you're using Territory forecasts, Enterprise Territory Management must be enabled first.
Step 1: Enable forecasting and configure the role hierarchy
In Forecast Settings, toggle on Enable Forecasts. Before you do anything else, verify your role hierarchy is set up correctly—forecasts roll up through roles, not reporting lines in your HR system. Every user who needs to appear in a forecast must have a Salesforce role assigned. If your hierarchy has gaps (users without roles, or roles that don't roll up to a manager), the forecast numbers will be incomplete.
[banner type="download" url="https://www.weflow.ai/content/the-ultimate-sales-forecasting-guide" text="The Ultimate Sales Forecasting Guide" subtitle="Build a forecast your CRO and board can actually defend" button="Get the guide"]
Step 2: Create and configure forecast types
In Forecast Settings, click Add a Forecast Type. Choose the object (Opportunity, Opportunity Product, etc.), the measurement field (Amount, Quantity, or a custom currency field), and the date field to forecast against (Close Date or a custom date). Give each type a clear display name—your reps will see this in the Forecasts tab.
Step 3: Enable quotas, adjustments, and manager judgments
In Forecast Settings, you can toggle on three key capabilities:
- Quotas: Lets you load rep and manager quotas into Salesforce so the Forecasts app can show gap-to-quota inline.
- Forecast Adjustments: Lets managers adjust a rep's rolled-up number without changing the underlying opportunities.
- Owner Adjustments: Lets individual reps adjust their own forecast—useful when a rep wants to signal upside or risk.
Step 4: Choose single vs. cumulative forecast rollups
In Forecast Settings, under Forecast Display, select either single or cumulative rollup. For most B2B sales orgs, cumulative is the better default—it gives your CRO a single Commit number that includes Closed Won.
Step 5: Customize forecast categories and stage mappings
Navigate to Setup > Object Manager > Opportunity > Fields & Relationships > Forecast Category to see the default stage-to-category mappings. Ensure every active stage maps to a category—unmapped stages default to Pipeline, which can skew numbers if late-stage deals land there accidentally.
Step 6: Design forecast pages in Lightning App Builder
The default Forecasts app layout is functional but often undersized for how RevOps teams actually run reviews. You can customize the Lightning page to add related lists, custom columns (gap-to-quota, pipeline coverage ratio), and charts.
How to improve Salesforce forecasting accuracy
Configuration is the foundation—but accuracy comes from data quality, process discipline, and the right supporting workflows.
Clean and validate your Salesforce data
Forecasts are only as accurate as the opportunity data behind them. The three most common data quality issues that break forecasts are stale close dates, missing amounts on active opportunities, and duplicate accounts or opportunities inflating pipeline. Fix these at the source with Salesforce validation rules and built-in Duplicate Rules.
Automate activity capture to eliminate missing data
One of the biggest sources of forecast inaccuracy is invisible activity—deals that look healthy in the pipeline because no one's updated them. Weflow solves this by automatically capturing emails, meetings, and calls and syncing them to the correct Salesforce records—without requiring reps to log anything manually.
Use historical trending to track forecast changes
Salesforce's Historical Trending feature lets you track how opportunity fields—including Amount, Stage, and Forecast Category—change over time. This is particularly valuable for identifying systematic over-optimism in your forecast.
Add custom columns for gap-to-quota and pipeline coverage
Add two custom columns to your forecast layout:
- Gap to quota:
Quota - Commit—shows how much more needs to close. - Pipeline coverage:
Best Case / Quota—shows how much best-case pipeline covers the remaining quota. Most orgs target 3–4x coverage.
Adjust forecasts for market, seasonal, and organizational changes
| Factor | Impact on forecast | Example |
|---|---|---|
| New rep ramp | Lower win rates and longer sales cycles for 3–6 months | 10 new AEs in Q1 will underperform quota in Q2 even with a full pipeline |
| Seasonal demand shifts | Q4 pushes create artificial pipeline concentration | December commit often overstates—build in a haircut for deals that slide to January |
| Product or pricing changes | New SKU or pricing model resets historical win rates | Consumption-based pricing makes ARR per deal harder to predict |
| Market conditions | Budget freezes or macro uncertainty extend sales cycles | If close rates drop 15% org-wide, update your commit-to-close conversion rate |
| Rep territory changes | Mid-year realignments create pipeline voids | A rep who took over a new territory has lower coverage quality than pipeline suggests |
Build a weekly, monthly, and quarterly forecast review cadence
| Cadence | Focus areas |
|---|---|
| Weekly | Commit changes vs. prior week, deal slippage, at-risk opportunities, manager adjustments |
| Monthly | Pipeline coverage for next month, stage conversion rates, data quality audit |
| Quarterly | Forecast vs. actual reconciliation, win rate by stage, forecast accuracy by rep and manager |
How does Einstein AI improve Salesforce forecast accuracy?
Einstein Forecasting is Salesforce's AI-powered prediction layer that sits on top of your collaborative forecast. It analyzes historical opportunity data, deal-level fields, and patterns from similar deals to generate a predicted close amount for each open opportunity.
[banner type="download" url="https://www.weflow.ai/content/sales-forecasting-cheat-sheet" text="Sales Forecasting Cheat Sheet" subtitle="Run weekly, monthly, and quarterly forecast reviews that catch slippage early" button="Get it free"]
The key insight Einstein surfaces is directional accuracy: if a rep consistently commits $500k and Einstein consistently predicts $380k—and actuals land at $390k—that tells you the rep is chronically over-forecasting.
Einstein also uses a Global Predictive Model for orgs that don't yet have enough historical data to train a company-specific model. Einstein Forecasting requires Sales Cloud Einstein or Revenue Intelligence, available on Enterprise and Unlimited editions.
How Weflow improves Salesforce forecasting
Weflow, a Salesforce-native revenue AI platform, adds a forecasting analytics layer on top of Salesforce built for the way RevOps teams actually run forecast reviews.
- Collaborative forecasting with waterfall tracking: See how your forecast has changed week over week in a visual waterfall.
- Automatic Salesforce sync: Weflow writes all activity data back to native Salesforce objects in real time.
- Pipeline inspection built for Salesforce: Surface deal risk signals directly in the context of your forecast review.
- Gap-to-quota and coverage views out of the box: Pipeline coverage, commit vs. quota gap, and best case upside inline.
Key takeaways for Salesforce forecasting success
- Get your role hierarchy right first. Gaps in the hierarchy mean gaps in your forecast rollup.
- Use cumulative rollups unless you have a specific reason not to. They reduce mental math during reviews.
- Clean data is the single biggest driver of forecast accuracy. Validation rules + automated activity capture eliminate the two most common data quality gaps.
- Run Einstein Forecasting alongside your manual forecast, not instead of it. Its value is as a second signal.
- Build a review cadence at three speeds: weekly for deal movement, monthly for pipeline coverage, quarterly for accuracy reconciliation.
Frequently asked questions
What is Salesforce forecasting?
Salesforce forecasting is a built-in feature that lets sales teams predict revenue for a given period based on the opportunities in their pipeline. Reps assign opportunities to forecast categories, and those categories roll up through the role hierarchy to give managers and executives a view of expected revenue at every level of the org.
How do I set up forecasting in Salesforce?
Go to Setup > Feature Settings > Sales > Forecasts > Forecast Settings and toggle on Enable Forecasts. From there, create your forecast types, configure your rollup method, map your opportunity stages to forecast categories, and optionally enable quotas and manager adjustments.
What are Salesforce forecast categories?
Forecast categories are labels that group opportunities by close confidence: Pipeline, Best Case, Most Likely, Commit, Closed, and Omitted. Each opportunity stage maps to one of these categories, and the categories determine how deals roll into the forecast.
What is the difference between single and cumulative forecast rollups?
Single rollup shows only the deals in that specific category for each forecast column. Cumulative rollup shows that category plus all more-certain categories—so the Commit column includes Closed Won, and Best Case includes Closed, Commit, and Most Likely.
How does Einstein AI improve Salesforce forecasting?
Einstein Forecasting analyzes your historical opportunity data, deal-level fields, and close patterns to generate an AI-predicted revenue number that runs alongside your manual forecast. It's most useful as a second signal when Einstein's prediction diverges from a rep's commit.
Why are my Salesforce forecasts inaccurate?
The most common causes are data quality issues (stale close dates, missing amounts, no activity logging) and misconfigured stage-to-category mappings. Automated activity capture and validation rules at stage progression fix the data quality side; a category mapping audit fixes the configuration side.
Can I forecast by product, territory, or revenue type in Salesforce?
Yes. Salesforce supports multiple forecast types simultaneously: Product Family, Overlay Split, Opportunity Revenue Split, and Territory. For new business vs. renewal vs. upsell splits, use a custom Opportunity Type field and build separate forecast types or filtered reports.
How often should I review my Salesforce forecast?
At minimum: weekly with front-line managers to catch deal movement, monthly to review pipeline coverage and data quality, and quarterly to reconcile forecast accuracy against actuals.
.avif)