32 Salesforce KPIs Sales Leaders Track to Fix Forecasts and Rep Performance [Cheat Sheet]
If your Salesforce dashboards show plenty of activity but your forecast still misses, you’re probably tracking the wrong metrics—or tracking the right ones with incomplete data. Sales leaders don’t need more charts. They need KPIs that explain where pipeline is leaking, which reps need coaching, and how much revenue is actually likely to close.
This guide breaks down 32 Salesforce KPIs into five groups: lead response, pipeline visibility, conversion ratios, rep performance, and revenue health. Use it to build cleaner dashboards, spot process gaps earlier, and base your forecast on operating data instead of rep intuition alone.
[banner type="download" url="https://www.weflow.ai/content/32-salesforce-kpis" text="32 Salesforce KPIs Sales Leaders Should Track" subtitle="Cheat sheet with 32 Salesforce sales KPIs, pipeline metrics, and conversion benchmarks." button="Download free"]Lead response metrics: capture interest before it fades
Top-of-funnel metrics tell you whether inbound demand is getting handled fast enough and whether outbound efforts are creating enough early engagement. Marketing usually owns lead volume, but sales owns response time, follow-up discipline, and the consistency of first-touch execution.
| Metric name | What it measures | Why it matters |
|---|---|---|
| Total amount of inbound leads | The count of new inbound leads created in Salesforce over a set period | Shows whether enough potential buyers are entering the funnel to support pipeline coverage |
| Visitor-to-lead conversion rate | The percentage of website visitors who submit a form or convert into a lead | Helps sales leaders separate traffic volume from actual lead creation |
| Lead response time | The time between lead creation and first sales touch | Response speed often decides whether inbound demand becomes pipeline or goes cold |
| Follow-up contact rate | The number and consistency of attempts to reach a lead | Shows whether reps are working leads long enough to create meetings |
| Email open rate | The percentage of outbound emails that get opened | Gives a directional read on subject lines, send times, and audience fit |
| Date of last contact | The most recent call, email, or logged activity tied to a lead | Prevents qualified leads from sitting untouched in Salesforce |
Track inbound lead volume and sources
Lead volume tells you how much raw demand is entering the funnel. On its own, though, volume can hide quality problems—especially if marketing is hitting MQL targets but sales isn’t converting those leads into opportunities.
- Total amount of inbound leads: Track new leads created by source, campaign, segment, and region so you can see whether volume is rising in the parts of the business that matter.
- Visitor-to-lead conversion rate: Divide converted leads by total website visitors to see whether site traffic is turning into named demand, not just pageviews.
These two numbers help sales leaders have a more useful conversation with marketing. If lead volume is up but visitor-to-lead conversion and lead-to-opportunity ratio are both down, the issue is usually traffic quality, form intent, or campaign targeting—not SDR execution.
Measure response times and follow-up rates
Once a lead enters Salesforce, speed and persistence matter more than almost anything else. This is where top-of-funnel process discipline shows up in the data.
- Lead response time: Measure the gap between lead creation and first logged touch. For high-intent demo requests, this should be measured in minutes or hours, not days.
- Follow-up contact rate: Track whether reps make enough attempts across calls, emails, and LinkedIn touches before marking a lead unresponsive.
- Date of last contact: Use this to find leads that were worked once, then abandoned before a clear outcome was recorded.
Best practice: In Salesforce, create a record-triggered Flow or a scheduled report for leads where Status is still open and LastActivityDate is blank or older than 48 hours. Route the alert to the rep, manager, or Slack channel so untouched leads don’t age out quietly.
Monitor email open rates for cold outreach
Callout: Email open rate is a directional metric, not a final verdict on outbound quality. If your sales engagement platform writes email events back to Salesforce, use open rates to test subject lines, sender names, and send times—but pair them with reply rate and meeting rate before you change your outbound process. Even with privacy changes that inflate opens, this metric still helps forecast how much outreach volume you’ll need to keep pipeline full.
Pipeline visibility: forecast revenue with high accuracy
Pipeline metrics turn a list of open opportunities into a usable forecast. They show how much revenue is sitting in play, how much of it is realistically likely to close, and where deals are stacking up in the funnel.
| Metric | How it’s calculated | Why leaders track it |
|---|---|---|
| Open pipeline value | Sum of Opportunity Amount for all open opportunities | Shows total revenue currently in play, regardless of stage probability |
| Expected value of sales pipeline | Sum of Opportunity Amount × Probability for all open opportunities | Creates a more realistic forecast by weighting each deal by likelihood to close |
Open pipeline value shows gross opportunity. Expected value applies stage probability to that same pipeline, which is why it’s more useful for forecasting. If you only look at open value, late-stage optimism can hide a gap until the last two weeks of the quarter.
Calculate open and expected pipeline value
- Open pipeline value: The total dollar amount of all active opportunities in Salesforce. This tells you whether you have enough raw pipeline to cover quota.
- Expected value of sales pipeline: The weighted value of that same pipeline after multiplying each opportunity amount by its stage probability. This tells you what your pipeline is more likely to produce.
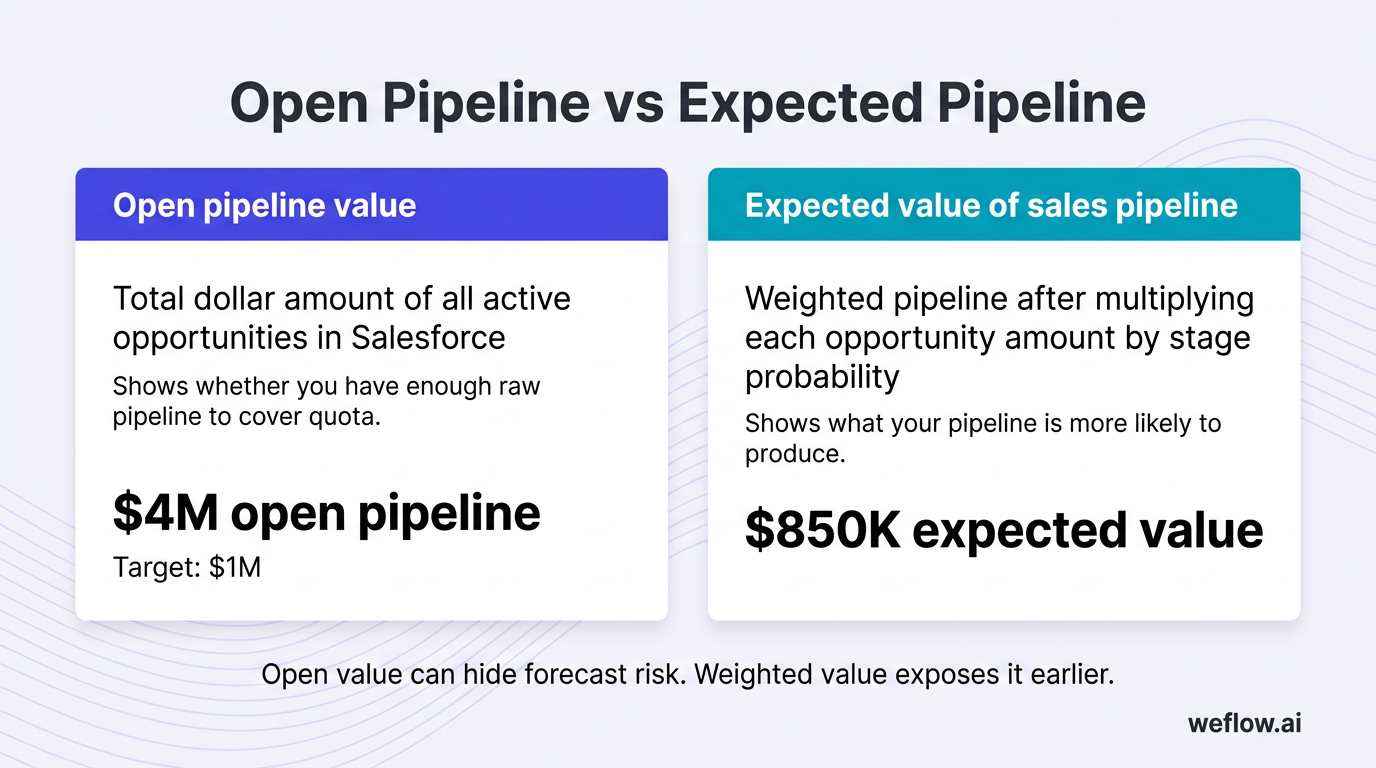
Together, these two metrics reduce end-of-quarter surprises. A team might show $4M in open pipeline against a $1M target, but if the expected value is only $850K, the forecast problem is already visible.
Forecast pipeline value using historical data
Rep intuition is useful in deal reviews, but it shouldn’t be the forecasting model. Historical conversion rates, stage duration, and close rates by segment usually predict revenue more reliably than rep judgment alone.
- Pipeline value forecast: Use prior-period win rates, stage-to-stage conversion, average deal size, and sales cycle length to model what current pipeline is likely to produce.
- Committed deals: Separate forecast categories such as Commit, Best Case, and Pipeline so leadership can compare rep judgment with historical patterns.
- Upgrades and expansions: Include expected expansion revenue from existing accounts if your Salesforce data model tracks renewals or upsells on a custom object or separate opportunity record type.
Map lead percentages across pipeline phases
Callout: Percentage of leads in each pipeline phase helps you find bottlenecks fast. A healthy distribution might look like 45% in qualification, 30% in discovery or demo, 15% in proposal, and 10% in negotiation. If 60% of records are stuck in proposal, your pipeline is top-heavy. If most leads never leave qualification, your funnel is bottom-heavy and your stage-entry criteria likely need work.
Conversion ratios: pinpoint where deals stall or close
Raw counts tell you volume. Ratios tell you efficiency. If one team creates 200 opportunities and another creates 120, that doesn’t tell you much until you compare how each group converts from lead to opportunity, opportunity to win, and demo to closed-won.
- Lead-to-opportunity ratio
- The percentage of leads that become qualified opportunities.
- Opportunity-to-win ratio
- The percentage of open opportunities that close as won business.
- Lead conversion rate
- The percentage of total leads that eventually become customers.
- Demo/trial conversion rate
- The percentage of demo or trial participants who convert to paying customers.
- Average time to conversion
- The average time required to move from one stage to the next.
- Deal-lost reasons
- The categorized reasons opportunities close as lost.
Analyze lead-to-opportunity and win ratios
- Lead-to-opportunity ratio: Measures whether inbound and outbound prospecting is creating real pipeline, not just lead volume.
- Opportunity-to-win ratio: Measures how effectively reps convert qualified opportunities into revenue.
- Lead conversion rate: Measures the full path from lead creation to customer, which makes it useful for board-level funnel reporting.
If lead-to-opportunity ratio is high but opportunity-to-win ratio is low, the problem usually isn’t lead quality. It’s more often pricing, late-stage execution, competitive positioning, or weak deal control after discovery.
Evaluate demo and trial conversion success
Demo/trial conversion rate shows whether your product story is landing once buyers get a hands-on look. Review it by rep, product line, and segment. If one rep books plenty of demos but converts few of them, that’s a coaching signal—listen to discovery calls, review how they tailor the pitch, and look for gaps between the buyer pain they uncover and the workflow they show.
Track average conversion time and lost deals
Average time to conversion shows how long deals sit between key stages such as qualification, discovery, proposal, and negotiation. Deal-lost reasons explain why they stop moving altogether.
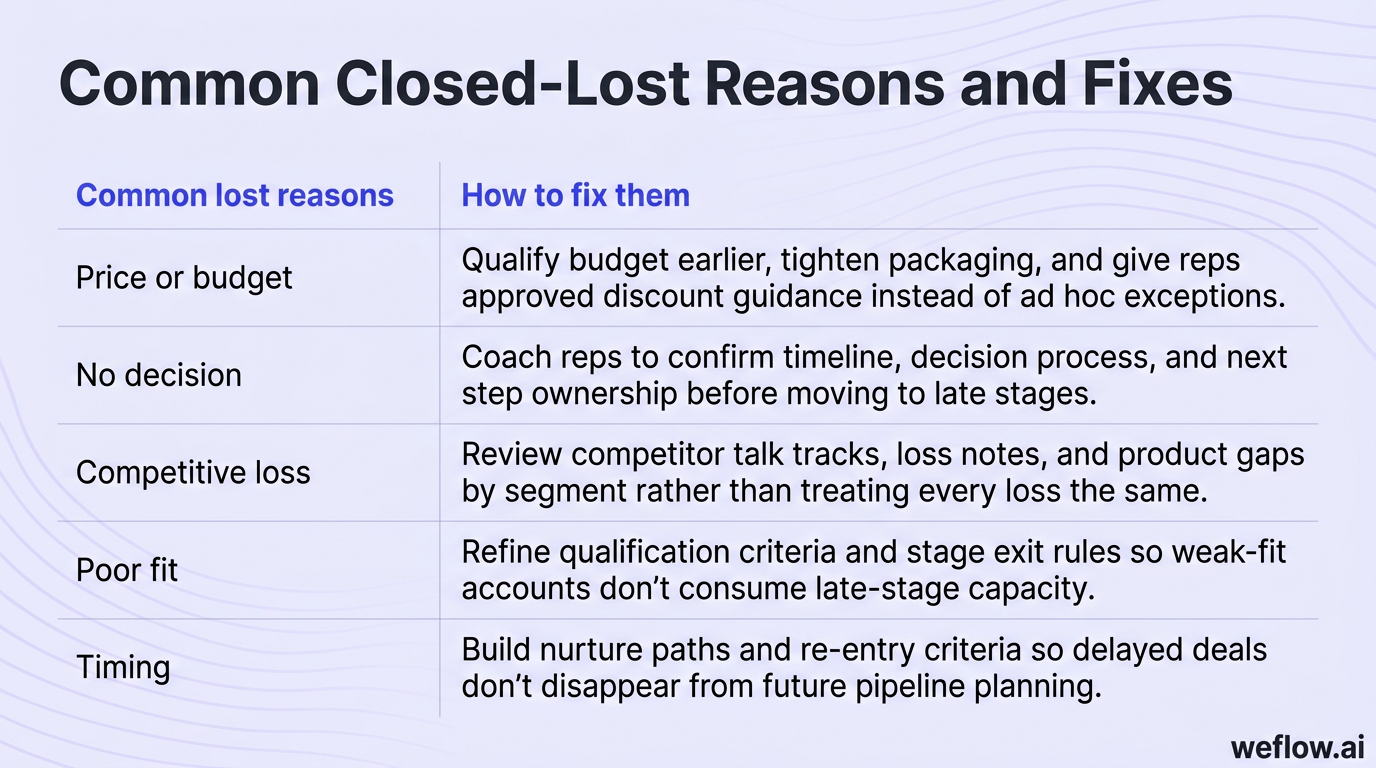
| Common lost reasons | How to fix them |
|---|---|
| Price or budget | Qualify budget earlier, tighten packaging, and give reps approved discount guidance instead of ad hoc exceptions. |
| No decision | Coach reps to confirm timeline, decision process, and next step ownership before moving to late stages. |
| Competitive loss | Review competitor talk tracks, loss notes, and product gaps by segment rather than treating every loss the same. |
| Poor fit | Refine qualification criteria and stage exit rules so weak-fit accounts don’t consume late-stage capacity. |
| Timing | Build nurture paths and re-entry criteria so delayed deals don’t disappear from future pipeline planning. |
For reporting accuracy, standardize Closed-Lost Reason as a required Salesforce picklist and use validation rules so reps can’t close an opportunity as lost without selecting a reason. Free-text loss notes are useful, but they won’t give RevOps clean reporting.
Rep performance tracking: align daily activity to quota
Rep KPIs connect daily behavior to revenue outcomes. The goal isn’t micromanagement. It’s to help managers see whether low performance comes from weak activity volume, weak activity quality, poor conversion, or account fit.
| Metric | Rep behavior | Manager action |
|---|---|---|
| Sales activity | How consistently a rep logs calls, emails, meetings, and follow-ups | Check whether activity completeness is high enough to trust pipeline reviews |
| Outbound calls | How much top-of-funnel effort a rep creates each week | Compare call volume against meetings created, not just dials made |
| Outbound calls contact rate | How often calls turn into actual conversations | Coach list quality, call timing, and talk tracks when contact rate drops |
| Number of demos | How often a rep converts activity into scheduled meetings | Use as an early indicator of pipeline creation skill |
| Quarterly performance | Whether a rep is pacing toward quota over a full quarter | Identify sustained underperformance earlier than annual reviews do |
| Sales per rep | How much revenue each rep closes relative to peers | Set baselines, find outliers, and normalize expectations by segment or territory |
| Churn by rep | Whether a rep closes accounts that stay and expand or leave quickly | Spot overpromising, weak qualification, or bad-fit selling behavior |
Log sales activities and outbound call volume
- Sales activity: Track calls, emails, meetings, tasks completed, and time spent on prospecting so managers can see whether pipeline gaps start with effort or with execution.
- Outbound calls: Track dial volume by rep, team, and week to understand whether outbound coverage is sufficient.
- Outbound calls contact rate: Compare successful conversations against total calls so you measure quality, not just quantity.
A rep who makes 80 calls with a 3% contact rate has a different problem than a rep who makes 30 calls with a 20% contact rate. One likely needs better targeting or timing. The other may simply need more activity.
Review quarterly performance and sales per rep
Quarterly performance shows whether a rep can sustain output across a full selling period, not just spike in one month. Sales per rep adds peer context, which helps leaders set realistic baseline quotas and identify outliers—both the top performers worth learning from and the reps who need support, territory changes, or tighter coaching.
Assess rep-specific churn and demo numbers
Callout: Number of demos scheduled is an early productivity metric. Churn by rep is a downstream quality metric. Track them together. If a rep books a high volume of demos, closes quickly, and still has the highest churn six months later, they may be overselling, discounting into bad-fit accounts, or skipping qualification criteria that protect long-term revenue.
Revenue and lifecycle KPIs: maximize long-term account value
Rep activity tells you how the team is working. Revenue and lifecycle KPIs tell you whether that work creates durable growth. These are the numbers that tie Salesforce reporting to company economics, margin, and retention.
- Average contract value (ACV): The average value of closed business over a set period.
- Revenue by product: The revenue contribution of each product or package sold.
- Sales volume by source: Which channels and campaigns generate actual closed revenue.
- Customer acquisition cost (CAC): The cost to win a new customer.
- Customer lifetime value (CLV): The revenue a customer generates across their relationship with your company.
- Average sales cycle length: The time it takes to close a deal.
- Average length of customer lifecycle: How long customers stay active after purchase.
- Upsell and cross-sell rates: How often customers expand after the initial sale.
- Customer satisfaction score (CSAT): A signal of account health and future expansion potential.
Calculate average contract and product revenue
- Average contract value: Measure ACV by segment, region, and product family so you can see where the team is winning larger deals and where discounting is pulling deal size down.
- Revenue by product: Track which offerings produce the most revenue and margin so sales leaders can direct focus toward the products that matter most to the business.
- Sales volume by source: Compare closed-won revenue by source—not just lead count—so paid channels, partnerships, events, and outbound are judged on revenue contribution.
Revenue by product matters because it changes how you coach and how you allocate pipeline generation. If one product sells easily but produces low margin, while another has a longer cycle but higher revenue quality, that should shape territory planning and sales plays.
Measure customer acquisition cost against CLV
Formula: CAC = total sales and marketing spend for a period ÷ number of new customers acquired
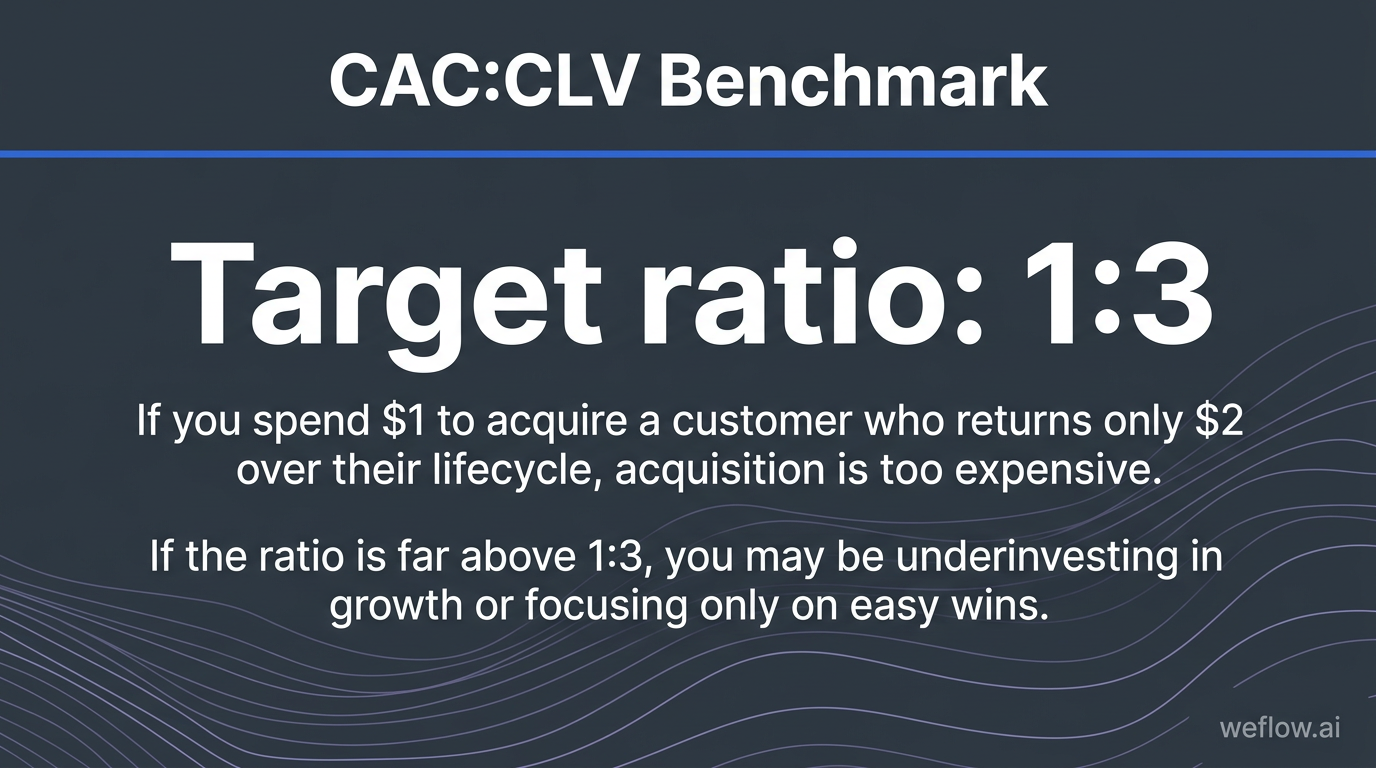
Formula: CLV = average purchase value × average purchase frequency × average customer lifespan
Benchmark: A common target is a CAC:CLV ratio of 1:3. If you’re spending $1 to acquire a customer who returns only $2 over their lifecycle, acquisition is too expensive. If the ratio is far above 1:3, you may be underinvesting in growth or focusing only on easy wins.
Monitor sales cycles and customer lifecycles
| Metric | What it shows | Target direction |
|---|---|---|
| Average sales cycle length | How long it takes to move from first meaningful engagement to closed-won | Shorter, as long as qualification quality stays high |
| Average length of customer lifecycle | How long customers stay active and continue to produce revenue | Longer, with strong retention and expansion |
A mature sales organization wants both: shorter time to close and longer time to retain. If the sales cycle gets shorter but lifecycle length drops, reps may be forcing deals through with weak qualification or heavy discounting.
Track upsell rates and customer satisfaction
- Upsell and cross-sell rates: Measure how often existing customers buy more, when they buy, and which prior purchases predict expansion.
- Customer satisfaction score (CSAT): Track post-sale satisfaction because unhappy customers rarely become expansion accounts, no matter how active your account team is.
CSAT is often treated as a support metric, but it’s also an early read on sales quality. Reps who sell to the right customers usually create accounts that renew, expand, and respond better to later cross-sell motions.
Next steps: build your custom Salesforce dashboard today
Don’t put all 32 KPIs on one dashboard and expect anyone to use it. Start with five to seven core metrics tied to your biggest operating problem—lead response, pipeline coverage, win rate, sales cycle, or churn—then build role-specific Salesforce dashboards for sales leaders, managers, and RevOps. As you audit your setup, remove vanity metrics that look good in a chart but never change a forecast call or coaching conversation.
FAQ
What are the most important Salesforce KPIs?
It depends on your sales model, but three metrics matter in almost every B2B organization: pipeline value forecast, win ratio, and average sales cycle length. Together, they tell you whether you have enough pipeline, whether deals are converting efficiently, and how long it takes revenue to show up after creation.
How do you measure sales rep performance?
Use a mix of input and output metrics. Input metrics include calls, emails, follow-up rate, and demos booked. Output metrics include sales per rep, quarterly attainment, win rate, and churn by rep. Looking at only one side creates blind spots—high activity with low conversion needs different coaching than low activity with strong conversion.
Which metrics improve sales forecasting accuracy?
Expected value of sales pipeline, average time to conversion, and historical pipeline value forecasts are usually the strongest drivers. Forecast accuracy improves when stage probability reflects actual conversion history, stage duration is measured consistently, and rep commit numbers are checked against historical close patterns instead of accepted at face value.
How often should sales leaders review KPIs?
Use a tiered review cadence. Check activity metrics such as lead response time and last contact daily. Review pipeline movement, conversion rates, and forecast changes weekly. Review revenue and lifecycle metrics such as CAC, CLV, upsell rate, and churn monthly or quarterly, since those trends need more time and more closed data to be meaningful.

.webp)