RevOps Reports and Dashboards That Track Pipeline Health and Flag Deal Risk [Cheat Sheet]
Forecast calls break down when Salesforce data is late, incomplete, or detached from what’s happening in buyer conversations. RevOps teams need a reporting layer that starts with clean activity data, reliable field mapping, and visible deal movement.
This guide covers the reports, dashboards, and deal inspection metrics that matter most for pipeline health. You’ll see how to build the data foundation first, then use deal-level and pipeline-level signals to flag risk early and forecast with more confidence.
[banner type="download" url="https://www.weflow.ai/content/revops-reports-cheat-sheet" text="RevOps Reports & Dashboards Cheat Sheet" subtitle="Get dashboard templates, report checklists, and CRM data capture frameworks for cleaner forecasting." button="Download now"]CRM data automation: build a foundation for accurate forecasting
Accurate forecasting starts before the dashboard. If emails, meetings, contacts, and qualification fields never make it into Salesforce, every deal review becomes part guesswork, part cleanup project.
This is why manual CRM updates fail in practice: reps are moving between Gmail, Outlook, Google Calendar, Zoom, Slack, and Salesforce all day. The moment data capture depends on memory and discipline, activity completeness drops, context gets lost, and your pipeline view starts drifting from reality.
For RevOps leaders, the standard should be simple: capture the data at the source, write it back to Salesforce automatically, and deploy in weeks, not quarters. If you’re migrating from Gong because shallow field mapping and manual workarounds still leave activity gaps in Salesforce, that architecture difference matters more than another call recording feature list.
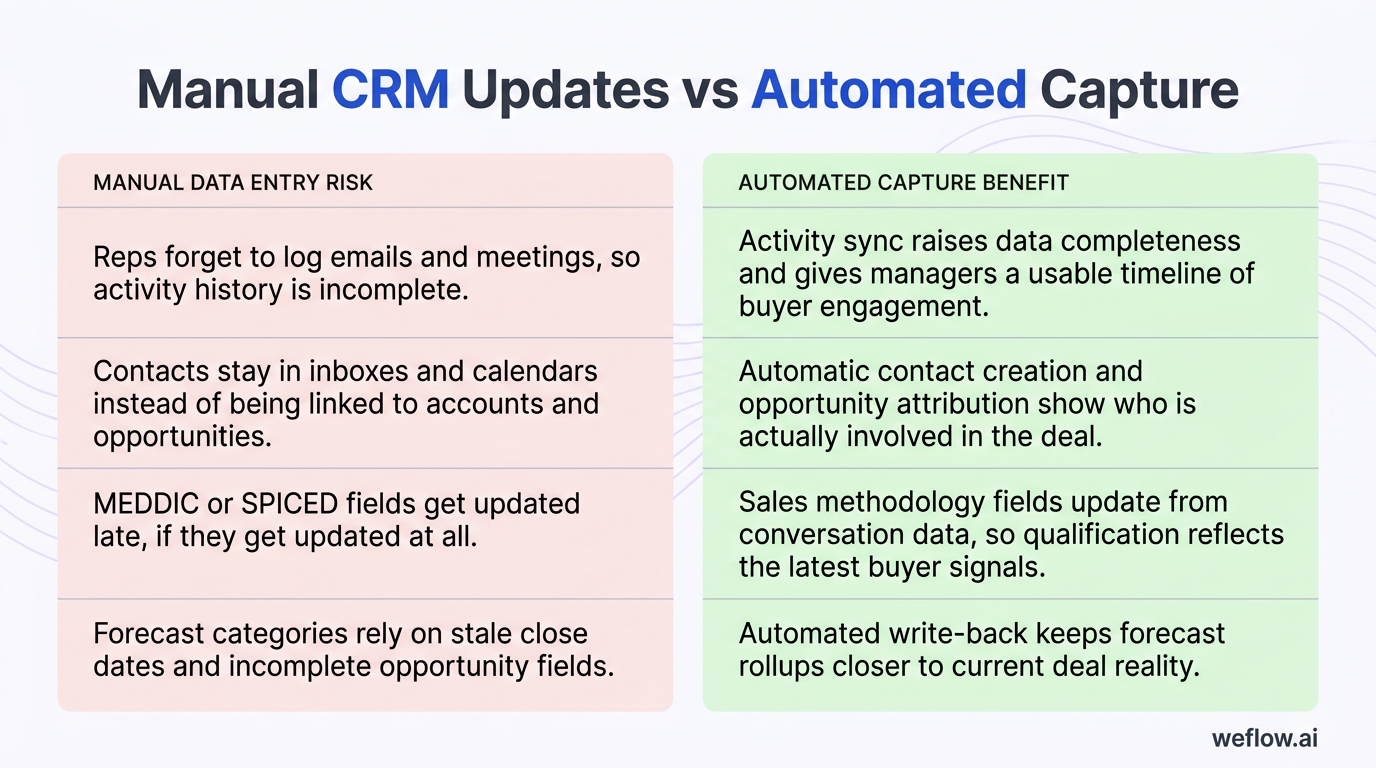
| Manual data entry risk | Automated capture benefit |
|---|---|
| Reps forget to log emails and meetings, so activity history is incomplete. | Activity sync raises data completeness and gives managers a usable timeline of buyer engagement. |
| Contacts stay in inboxes and calendars instead of being linked to accounts and opportunities. | Automatic contact creation and opportunity attribution show who is actually involved in the deal. |
| MEDDIC or SPICED fields get updated late, if they get updated at all. | Sales methodology fields update from conversation data, so qualification reflects the latest buyer signals. |
| Stage progression depends on rep judgment without data controls. | Stage exit criteria and validation rules keep pipeline hygiene consistent across teams and regions. |
| Forecast categories rely on stale close dates and incomplete opportunity fields. | Automated write-back keeps forecast rollups closer to current deal reality. |
| RevOps spends review time correcting records instead of inspecting deals. | Managers can spend pipeline reviews on risk, coverage, and next steps rather than CRM cleanup. |
Capture activity data to reveal deal velocity
In deal inspection, deal velocity means how quickly a specific opportunity is moving forward based on real buyer and seller activity. It’s not just the age of the deal. It’s the pace of meaningful touchpoints, stakeholder expansion, and progress toward the next commitment.
Manual activity logging breaks that view. Reps log some meetings, forget email threads, miss new stakeholders, and rarely keep contact-role data clean enough for RevOps to trust it. The result is a pipeline that looks quieter—or healthier—than it really is.
- Auto-capture emails and meetings from Google Workspace or Microsoft 365: Pull seller-buyer activity into Salesforce without relying on rep memory.
- Map activities to the correct opportunity: Match emails, calendar events, and contacts to open deals so inspection happens at the opportunity level, not just the account level.
- Let reps adjust attribution in Outlook, Gmail, or Google Calendar: Automation works better when reps can fix edge cases without opening another tab.
- Create missing contacts from real interactions: This improves buying committee visibility and reduces contact-role gaps.
- Write activity back to Salesforce standard and custom objects: That matters if your team reports off custom opportunity workflows, business unit fields, or regional process variations.
For Salesforce admins, the main question isn’t whether activity capture exists. It’s whether the sync logic creates usable Salesforce data with a small integration footprint, clear field mapping, and enough control to support Enterprise and Unlimited edition governance.
Record and summarize sales conversations
Sales conversations carry the details that rarely make it into opportunity fields on time: objections, implementation concerns, legal blockers, next steps, procurement timing, and whether the champion still has internal momentum. Manual note-taking misses too much of that context and creates uneven CRM hygiene across reps.
Conversation intelligence solves that when it records, transcribes, summarizes, and syncs the output back to Salesforce. The goal isn’t more content in a library. The goal is better data completeness on the record your managers actually inspect.
Productivity benefit for reps: Reps spend less time writing recap notes, updating fields after the meeting, and rebuilding context before the next call. That cuts admin work while improving the quality of what lands in Salesforce.
For RevOps, conversation data also surfaces coaching moments earlier. If AI summaries repeatedly show weak discovery, pricing objections, or no confirmed next step after late-stage calls, you’ve found a process issue before it shows up as a slipped commit.
Sync sales methodology fields to CRM records
Sales methodology only helps forecasting if the framework lives in Salesforce as current data, not as a slide deck or a manager’s opinion. When qualification fields stay blank or stale, unqualified deals inflate pipeline coverage and distort forecast categories.
A single methodology field can change a forecast fast. If Economic Buyer moves from unknown to confirmed with direct access, a deal that looked like loose upside may now belong in best case with a higher inspection priority.
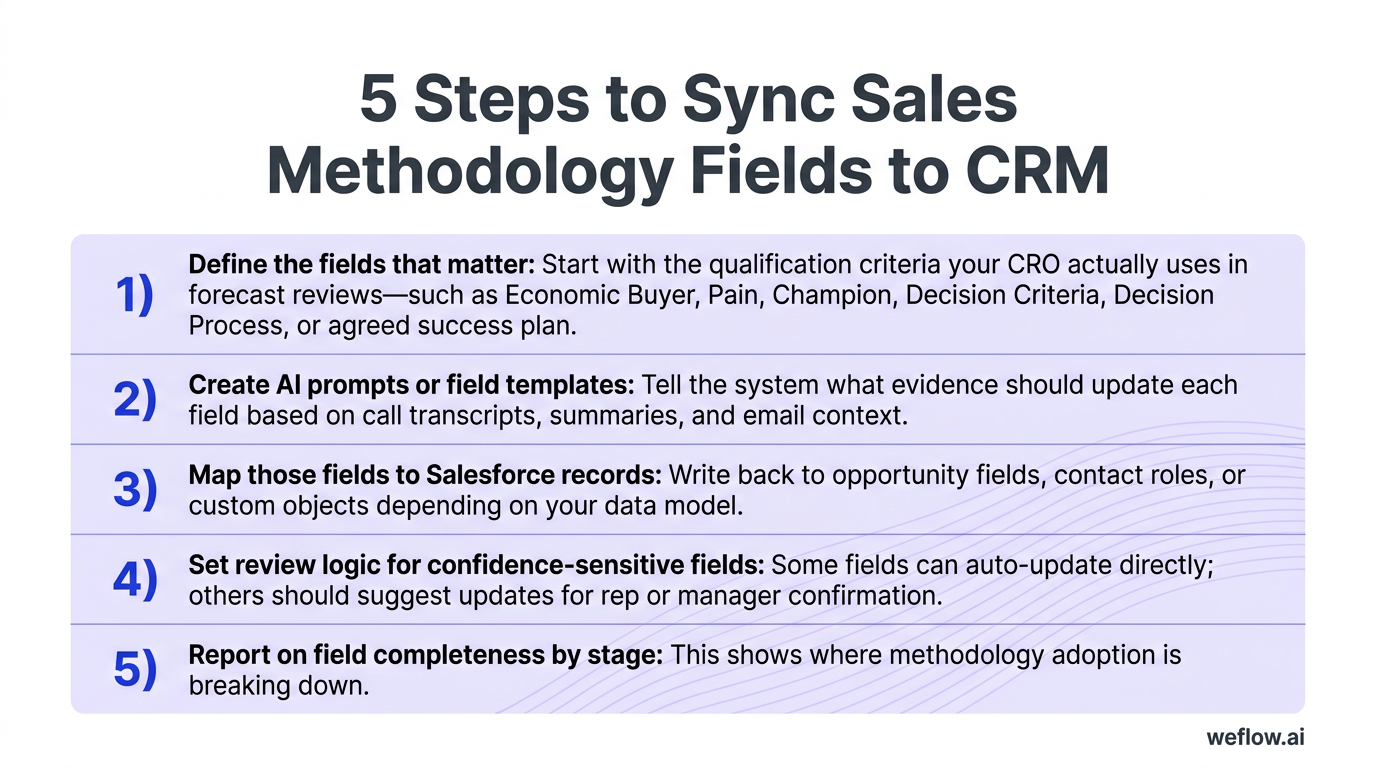
- Define the fields that matter: Start with the qualification criteria your CRO actually uses in forecast reviews—such as Economic Buyer, Pain, Champion, Decision Criteria, Decision Process, or agreed success plan.
- Create AI prompts or field templates: Tell the system what evidence should update each field based on call transcripts, summaries, and email context.
- Map those fields to Salesforce records: Write back to opportunity fields, contact roles, or custom objects depending on your data model.
- Set review logic for confidence-sensitive fields: Some fields can auto-update directly; others should suggest updates for rep or manager confirmation.
- Report on field completeness by stage: This shows where methodology adoption is breaking down.
If you’re replacing Gong, this is one of the biggest differences to test. Many teams don’t need more transcripts—they need deeper Salesforce write-back, broader field mapping, and less manual cleanup to make MEDDIC data usable in reports.
Enforce stage exit criteria for key CRM fields
Stage exit criteria are the quality control gate for your pipeline. They prevent deals from moving forward unless the minimum fields required for inspection, forecasting, and board reporting are complete.
In Salesforce, this usually means a mix of required fields, validation rules, automation, and manager process. Without those controls, stage progression becomes a rep opinion rather than a data-backed signal.
- Stage: The current stage should reflect the actual buying motion, not where the rep hopes the deal is.
- Amount: Forecast rollups break when amount is blank, stale, or not aligned to the current product mix.
- Close date: A close date must match the latest buyer commitment, not default quarter-end behavior.
- Products: If your team forecasts by product line, package, or SKU family, product data needs to be complete before later stages.
- Forecast category: This is often automated from stage, close date, methodology completeness, or manager judgment.
For Salesforce admins, the clean setup is usually to enforce these fields through validation rules on stage change and automate forecast category updates where the business logic is stable. That gives RevOps a cleaner pipeline without turning every deal update into a service ticket.
Deal health indicators: spot risks before opportunities stall
Once automated capture is in place, deal health becomes easier to inspect because the signals are based on real activity and real conversations, not partial CRM updates. This is where RevOps can move from passive reporting to early risk detection.
The four indicators below work best together. A deal with high meeting volume but no next step, weak stakeholder access, or poor conversation context is still risky. Clean data lets you see that sooner.
Define clear next steps to maintain momentum
Every healthy deal needs a specific future commitment. If the next step is vague, unscheduled, or owned only by the seller, the opportunity usually stalls before the rep notices it.
- Group demo scheduled with date, time, and named attendees from the buyer side
- Trial onboarding scheduled with success criteria and owner
- Security review scheduled with IT or security stakeholders
- Legal redline process started with documents shared and owners confirmed
- Executive alignment call booked with the recommender and approver
- Commercial review scheduled with procurement or finance
Weak next step: “Following up next week.”
Strong next step: “Security review scheduled for Thursday with IT, procurement, and the VP of Operations; rep to send questionnaire by Tuesday.”
Caution: If a late-stage deal has no calendar-backed next step, forecast confidence should drop immediately.
Track activity velocity to gauge buyer urgency
Activity velocity shows whether a deal has enough recent movement to support the stage and close date on the opportunity. It should include both seller effort and buyer response. One-sided activity is not momentum.
- Emails sent and received: Measure actual back-and-forth, not just outbound volume.
- Meetings held and meetings scheduled: Past meetings show engagement history; future meetings show forward motion.
- Redline exchanges: Contract activity is a strong late-stage progress signal.
- Activity trend: Track whether engagement is rising, flat, or declining over the last 14 to 30 days.
A healthy deal usually shows frequent, two-sided touchpoints and at least one upcoming buyer commitment. Low velocity often means lost urgency, weak champion strength, or a deal that’s parked in the wrong stage.
Caution: High outbound emails with no buyer replies should be treated as declining engagement, not healthy velocity.
Verify multi-threading and access to power
Multi-threading measures whether the rep has built relationships with more than one stakeholder. Access to power checks whether any of those relationships include the people who recommend or approve the purchase.
| Single-threaded deal | Multi-threaded deal | |
|---|---|---|
| Stakeholder coverage | One active contact, often a manager or end user | Multiple engaged contacts across user, manager, technical, and economic roles |
| Decision visibility | Rep depends on secondhand information about budget and process | Rep hears priorities and blockers from people involved in the decision |
| Deal risk | High risk if the champion leaves, loses influence, or misstates internal process | Lower risk because support exists across the buying committee |
| Forecast confidence | Low confidence, even if activity volume looks healthy | Higher confidence because stakeholder coverage supports the stage and close plan |
A quick way to spot the wrong persona is this: if all the activity sits with someone who can evaluate the tool but can’t advance budget, security, or approval, the rep is not talking to power yet.
Caution: A friendly champion without an engaged recommender or approver is not enough for a late-stage commit.
Review communication context with AI summaries
Metrics without context create false comfort. A deal can show strong activity, multiple meetings, and a full contact list while the latest calls reveal budget pushback, unclear success criteria, or a buyer who wants to wait until next quarter.
That’s why AI summaries matter in deal inspection. They let RevOps and managers see what actually happened in recent calls and email threads without replaying every interaction. They also help validate whether methodology fields still match the real state of the deal.
Pro tip: In weekly pipeline reviews, open the AI summary first for deals that have healthy activity but no stage change, repeated close-date pushes, or no movement in stakeholder coverage. Those are the deals most likely to look fine in a dashboard and still miss.
If your platform can auto-update methodology fields from that communication context, even better. It reduces the gap between what the buyer said and what Salesforce says.
Pipeline health analytics: identify revenue gaps and trends early
Deal inspection tells you which opportunities need intervention. Pipeline analytics tell you whether the quarter is structurally healthy. RevOps needs both.
A useful way to group these metrics is by purpose. Forecasting metrics tell you whether enough qualified pipeline exists to hit the number and how accurate your prediction model is. Process optimization metrics show where conversion, speed, or channel quality is breaking down.
| Metric name | Definition | Business value |
|---|---|---|
| Pipeline value and pacing | Total open pipeline and how it changes over time by segment, geo, stage, or forecast category. | Shows whether pipeline volume is building fast enough to support future attainment. |
| Pipeline waterfall | Change analysis that breaks pipeline movement into drivers such as new opportunities, amount changes, slips, pull-ins, closed-won, and closed-lost. | Helps RevOps explain exactly why the quarter improved or deteriorated. |
| Stage conversion | Rate at which deals move from one stage to the next over a given period. | Identifies leakage points by segment, territory, industry, or team. |
| Pipeline coverage | Open pipeline divided by quota or revenue target for a future period. | Shows whether the business has enough qualified pipeline to hit plan. |
| Opportunities created | New opportunities created by period, source, segment, or channel. | Measures top-of-funnel health and channel quality. |
| Sales cycle length | Average number of days from opportunity creation to closed-won or closed-lost. | Shows how efficiently the go-to-market engine converts pipeline into revenue. |
| Pipeline velocity | Rate at which qualified pipeline turns into revenue using opportunity count, deal size, win rate, and sales cycle length. | The clearest single metric for overall pipeline efficiency. |
| Win rate | Percentage of opportunities that close won out of total opportunities. | Shows conversion effectiveness and qualification quality. |
| Average time in stage | Average duration deals spend in each pipeline stage. | Highlights bottlenecks and stage definitions that may need cleanup. |
| At-risk opportunities | Dashboard view of deals with delay, low engagement, missing next steps, or weak stakeholder coverage. | Supports proactive intervention before revenue is lost or slipped. |
| Pipeline flow | Visualization of how opportunities move through stages, including progression and drop-off. | Makes funnel friction and stage leakage easier to spot. |
| Forecast vs. actuals | Comparison of predicted revenue against actual closed revenue. | Measures forecast error rate and improves future forecast models. |
Monitor pipeline value, pacing, and waterfall
These are the baseline views for quarter health. They tell you whether enough pipeline exists and what’s driving change week to week.
- Pipeline value: Total open pipeline for the target period, sliced by segment, geo, stage, product, or forecast category.
- Pacing: Whether current pipeline creation and expansion trend is ahead of, on, or behind plan versus historical benchmarks.
- Waterfall inputs: New opportunities, amount increases, amount decreases, pulled-in deals, slipped deals, closed-won, and closed-lost.
A waterfall chart is useful because it shows pipeline leakage as movement, not just as a final total. You can see whether the quarter is weakening because creation slowed, big deals slipped, or late-stage pipeline shrank.
Analyze stage conversion and pipeline coverage
Coverage tells you if there is enough pipeline. Stage conversion tells you how much of that pipeline is likely to survive. You need both to avoid false confidence.
- Stage conversion rate: Use this to find where deals stall or drop out by stage, rep, segment, territory, or industry.
- Pipeline coverage: Most teams use a rough benchmark of 3x to 4x coverage, but the right number depends on win rate, deal size, and cycle length.
- Opportunities created by channel: Compare sourced pipeline quality across outbound, inbound, partner, and expansion motions.
If your coverage looks healthy but stage conversion is weak, the problem is qualification or execution. If conversion is strong but coverage is thin, the problem sits earlier in demand generation or pipeline creation.
Measure sales cycle length and pipeline velocity
Sales cycle length and pipeline velocity show how fast your revenue engine moves. For RevOps, these are core metrics because they connect rep execution, buyer urgency, and forecast timing.
Pipeline velocity formula: (Number of Opportunities × Average Deal Size × Win Rate) ÷ Average Sales Cycle Length
- Sales cycle length by segment or rep: Shows where deals take longer than expected and where playbooks differ.
- Average time in stage: Finds bottlenecks inside the cycle, which is usually more useful than looking at total cycle length alone.
- Win rate: Indicates whether the team is moving the right deals forward.
- Pipeline velocity: Combines volume, deal size, conversion, and time into one operating metric.
Reducing time in stage improves pipeline velocity directly. If legal review drops from 21 days to 12 days, revenue moves faster even when deal count and win rate stay flat.
Flag at-risk opportunities and pipeline flow
These dashboards are built for intervention. They help RevOps and sales leaders see where to act before the quarter closes.
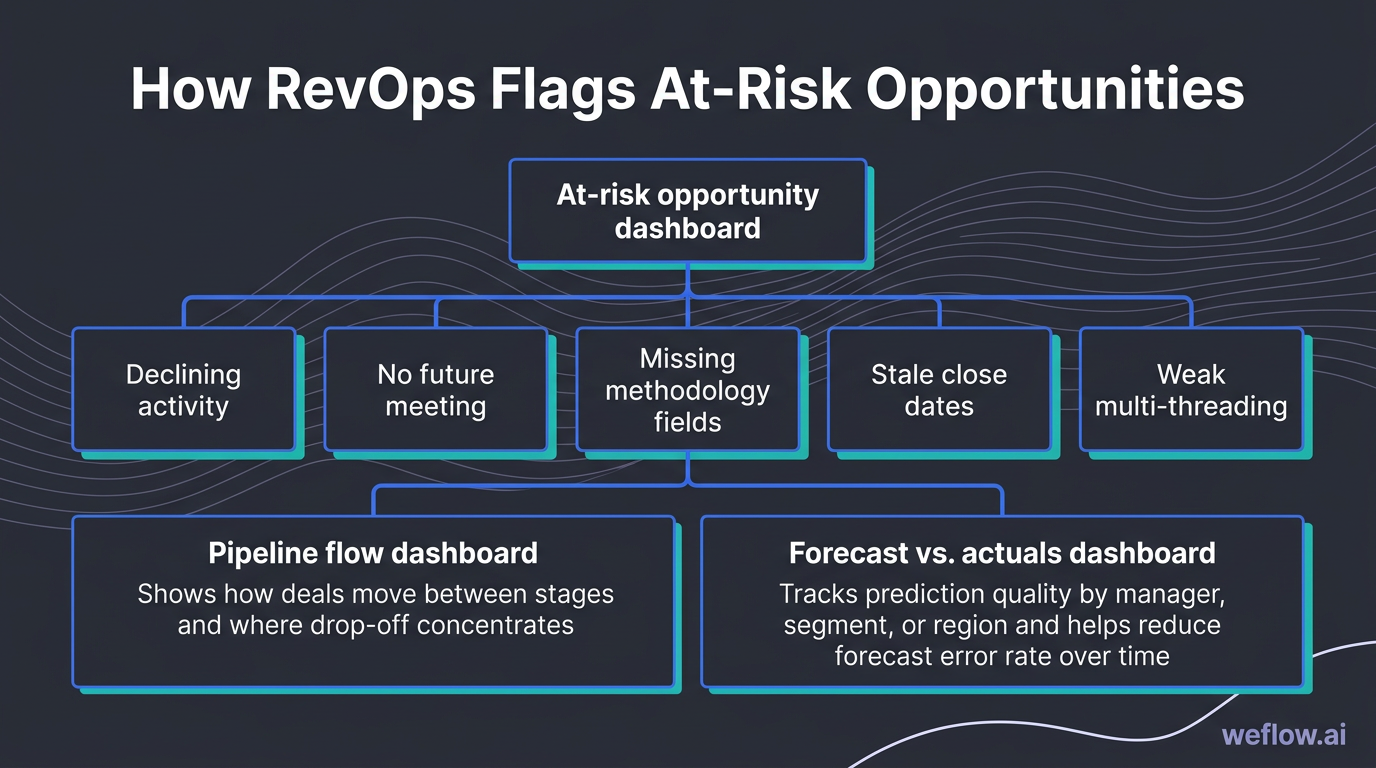
- At-risk opportunity dashboard: Flags deals with declining activity, no future meeting, missing methodology fields, stale close dates, or weak multi-threading.
- Pipeline flow dashboard: Shows how deals move between stages and where drop-off concentrates.
- Forecast vs. actuals dashboard: Tracks prediction quality by manager, segment, or region and helps reduce forecast error rate over time.
A Sankey diagram is a flow chart with thick lines showing volume moving from one stage to the next. The thicker the line, the more deal value or count is moving through that path. It’s useful when you want to see where funnel volume narrows fastest.
Team performance metrics: uncover coaching opportunities quickly
These metrics help managers coach behavior that improves pipeline quality. They should not be used as a rep surveillance system. If the data turns into micromanagement, adoption drops and the signal quality gets worse.
Conversation metrics: Talk ratio, longest monologue, longest customer story, interactivity score, question rate, and patience.
Activity metrics: Meeting volume, email volume, call volume, meeting duration, total time in meetings, email response time, email reply rate, and fast team response.
Evaluate talk ratio and interactivity scores
Conversation quality matters because it shapes qualification quality. If a rep dominates the call, discovery suffers and risk stays hidden until late in the cycle.
| Metric | Good | Bad |
|---|---|---|
| Talk ratio | Rep speaks roughly 40% to 60% of the time, leaving room for buyer context. | Rep speaks nearly the whole call, turning discovery into a pitch. |
| Longest monologue | Short rep stretches with frequent buyer participation. | Long uninterrupted rep speaking blocks that limit buyer input. |
| Longest customer story | Buyer shares detailed context, internal process, or pain in an extended response. | Buyer responses stay short, shallow, or purely transactional. |
| Interactivity score | Frequent speaker changes and active back-and-forth. | Low turn-taking and a one-sided meeting pattern. |
A long customer story is a strong buying signal because it usually means the buyer trusts the rep enough to explain internal pain, political context, or decision criteria in detail. That’s the input good qualification depends on.
Assess question rate and rep patience levels
Question rate and patience tell you whether a rep can run discovery without rushing the buyer. They’re useful leading indicators for coaching because they show behavior before win rate changes.
- Question rate: Track how many questions the rep asks per call or per minute. A healthy rate usually signals curiosity, qualification rigor, and a structured discovery process.
- Patience: Measure how long the rep waits before speaking after the buyer finishes. Higher patience often means better listening and fewer interruptions.
- Coaching use: Low question rate plus low patience usually points to early pitching, weak discovery, and missed objection signals.
Higher patience scores often correlate with better rapport because buyers get space to finish their thought, surface objections, and share the details reps need to move the deal forward.
Track meeting volume and average duration
Activity output still matters. The point is to read it with context so managers can distinguish healthy effort from bad time allocation.
- Meeting volume: Number of meetings held over a period. Useful for capacity planning and pipeline workload analysis.
- Email and call volume: Indicates outreach effort and follow-up cadence.
- Average meeting duration: Too short can mean poor prep or weak buyer engagement; too long can mean scope drift or inefficient calls.
- Total time spent in meetings: Shows whether reps have enough time left for prospecting, follow-up, and deal progression work.
Watch internal meeting load closely. If reps spend too much time in internal syncs, forecast calls, and handoff meetings, active selling time gets squeezed and pipeline creation usually drops a few weeks later.
Measure email response times and reply rates
Response metrics tell you two things at once: how responsive your team is and how engaged buyers are. Both affect cycle time.
Correlation to win rate: Faster response time keeps buyer intent from cooling off between interactions, especially in competitive deals where the other vendor replies first.
- Email response time: Average time it takes your team to reply to inbound buyer emails.
- Email reply rate: Percentage of outbound emails that receive a response from prospects or customers.
- Fast team response: Cross-team responsiveness across sales, solutions, security, and customer-facing teams.
A practical baseline SLA for inbound prospect emails is within 4 business hours during the work week, with one business day as the outside limit for lower-priority threads. If your sales process depends on fast coordination with solutions, legal, or security, track those handoff response times too.
Strategic initiative trackers: align GTM motions with buyer needs
RevOps can do more than inspect pipeline and rep activity. Conversation trackers also help Product, Marketing, and CS teams understand what buyers are reacting to in the market.
- Competitor mentions: Show where competitive pressure is rising and where battlecards need work.
- Objection handling: Reveals recurring hesitation around price, timing, fit, security, or implementation.
- Value proposition tracking: Shows whether reps are using the message the company trained them on.
- New product launch mentions: Indicates whether the market understands and reacts to what just launched.
- Next steps and deal momentum: Measures whether calls end with clear commitments.
- Churn-risk language: Helps customer-facing teams intervene before renewal risk becomes visible in lagging metrics.
This is data RevOps can share beyond sales leadership. Product teams can use objection and competitor trends to prioritize roadmap decisions. Marketing can adjust messaging based on value proposition usage and buyer response. CS can use risk language trackers to protect renewals earlier.
Monitor competitor mentions and objection handling
Competitor and objection trackers turn anecdotal call feedback into a measurable trend. That makes them useful for both coaching and strategy.
- Price: “You’re more expensive than other options.”
- Timing: “We want to revisit next quarter.”
- Fit: “This doesn’t cover our workflow or integration needs.”
- Implementation: “We can’t take on another long systems project.”
- Security or compliance: “We need more clarity from IT or procurement.”
Tracking objections over time helps you separate rep skill gaps from company-level issues. If price objections spike across segments, you may have a packaging or competitive positioning problem. If implementation objections cluster in enterprise deals, your onboarding motion or technical proof may need work.
Track value proposition and new product launches
Messaging data helps answer a simple question: did the enablement actually make it to the floor, and did buyers respond to it?
- Value proposition consistency: Measures how often reps use the company’s priority messaging and whether buyers engage with it.
- New product or feature mentions: Tracks how frequently launched products appear on sales and customer calls.
- Next steps and deal momentum: Shows whether those conversations lead to follow-on meetings, evaluations, or commercial steps.
This is one of the cleanest ways to validate enablement adoption. If the new message was trained last month but barely appears in calls, training didn’t stick. If it appears often but next steps don’t improve, the message may be clear but not persuasive.
Identify churn risks through customer language
Post-sale conversation data matters just as much as pipeline data. The same reporting discipline that helps Sales RevOps inspect opportunity health can help CS RevOps spot renewal risk earlier.
Churn-risk keywords and phrases: “We’re not seeing value,” “adoption is low,” “the team isn’t using it,” “we may pause,” “budget is getting cut,” “we’re evaluating alternatives,” “support has been slow.”
When those patterns show up repeatedly in customer calls or email threads, CS teams can intervene before the renewal is formally at risk. That closes the loop between pre-sale and post-sale operations: better conversation tracking helps both new revenue and retained revenue.
FAQ
What is the most important pipeline health metric?
Pipeline velocity is the most useful single metric because it combines opportunity volume, average deal size, win rate, and sales cycle length into one number. It gives RevOps a clearer view of pipeline efficiency than coverage or win rate alone.
How often should RevOps review deal health?
Review deal health weekly. That cadence is frequent enough to catch stale close dates, missing next steps, and engagement drops early, but not so frequent that managers turn pipeline reviews into constant record maintenance.
Why is CRM data automation critical for forecasting?
Manual data entry creates incomplete and biased Salesforce records because reps log activity unevenly and update fields late. Automation improves data completeness, keeps opportunity context closer to real time, and reduces forecast decisions based on missing information.
How do you measure sales pipeline velocity?
Use this formula: (Number of Opportunities × Average Deal Size × Win Rate) ÷ Average Sales Cycle Length. To make the number useful, calculate it by segment or region and keep the inputs clean with consistent opportunity stage definitions and close-date hygiene.

.webp)