8 Sales Forecasting Fixes to Build Accurate, Efficient Forecasts [Framework]
Most sales teams don’t have a forecasting math problem. They have a process problem—missing Salesforce data, unclear stage rules, and too much spreadsheet work between reps, managers, and the CRO.
This framework breaks forecasting into eight fixes you can implement in order. Start with data capture, then tighten forecast categories, roll-ups, and snapshots until your number is based on evidence instead of gut feel.
Forecasting challenges: why pipeline visibility breaks down
Forecast accuracy is still the exception. Korn Ferry found that only 25% of sales teams achieve more than 75% forecasting accuracy. At the same time, 42% of teams still forecast in spreadsheets, based on an analysis of 378 opportunities. That combination tells you most teams are still stitching together a forecast after the fact instead of running one as an operating system.
The underlying causes are usually familiar: market volatility, incomplete data, human bias, buyer curveballs, changing buyer behavior, weak process standards, new product lines, and siloed data. Those issues show up in three places first.
| Symptom | What it looks like in Salesforce | Impact on pipeline and forecast |
|---|---|---|
| Missing CRM data | Opportunity fields are blank, activity data isn’t written back to standard objects, and MEDDICC or stage exit criteria aren’t captured consistently. | Pipeline hygiene drops, forecast categories become guesswork, and weighted models overstate what will close. |
| Poor visibility | Close dates move without a clear audit trail, deal momentum is hard to inspect, and managers can’t see week-over-week pipeline changes. | Deals slip or stall without warning, coverage looks stronger than it is, and risk only shows up during the forecast call. |
| Inefficient forecast process | Managers collect numbers in spreadsheets, chase updates in Slack, and rebuild roll-ups manually each week. | Forecast submissions are late, manager adjustments aren’t traceable, and executive reviews focus on reconciling numbers instead of deciding what to do next. |
Gut-feeling forecasts used to survive when deal cycles were shorter and buying committees were smaller. In modern B2B sales, that breaks fast. If your forecast depends on one manager remembering which enterprise deal slipped, or a rep updating Salesforce 10 minutes before the pipeline review, the number won’t hold up.
CRM data capture: standardize inputs for reliable outputs
A forecast is only as good as the data feeding it. Gartner reports that 53% of sales teams say they have poor CRM data quality, and RevOps teams see the same pattern inside Salesforce: missing next steps, stale close dates, activity gaps, and stages that don’t reflect what’s actually happening in the deal.
This is where many teams hit a wall with tools that capture conversations well but write back shallow data to Salesforce. If you’re using Gong and still struggling to report on activity completeness, deal risk, or stage compliance in Salesforce, the issue usually isn’t rep effort. It’s limited field mapping, partial activity sync, or data that lives outside the Opportunity, Task, and Event records your forecast depends on.
The fix is simple in concept and hard in execution: define what must exist on the Opportunity at each stage, automate capture where possible, and use validation rules or workflow logic so reps don’t have to remember every update manually.
Essential Salesforce fields and signals to capture:
- Account ICP fit
- Primary use case and segment
- Opportunity amount and ARR field
- Close date and close date change count
- Current stage and stage entry date
- Forecast category
- Next step and next step last updated date
- Last activity date on standard Task and Event objects
- Buying committee mapped
- Economic buyer identified
- MEDDICC or SPICED fields completed
- Mutual action plan or agreed timeline
- Risk flags, such as no meeting booked or no stakeholder response
Define qualified opportunities and stages
If you don’t define when a deal enters the forecast, reps will fill the gap with optimism. A clean forecast starts with a clean opportunity definition.
Checklist for qualified opportunities and stage control:
- The account matches your ICP and target segment.
- A second meeting is booked or completed.
- The buying committee is partially or fully mapped.
- A business problem and success criteria are documented.
- Stage entry and exit criteria are written in Salesforce and enforced with validation rules.
- MEDDICC, SPICED, or your chosen methodology is mapped to specific required fields.
- Forecast category rules are separate from stage names, so managers can inspect both.
Here’s the common failure mode: a rep moves a deal to “Proposal” because pricing was discussed on a call, but procurement hasn’t started, the economic buyer hasn’t weighed in, and no timeline exists. The stage says late pipeline. The evidence says early evaluation. That one mismatch inflates weighted pipeline and contaminates your commit number.
Score pipeline hygiene to enforce compliance
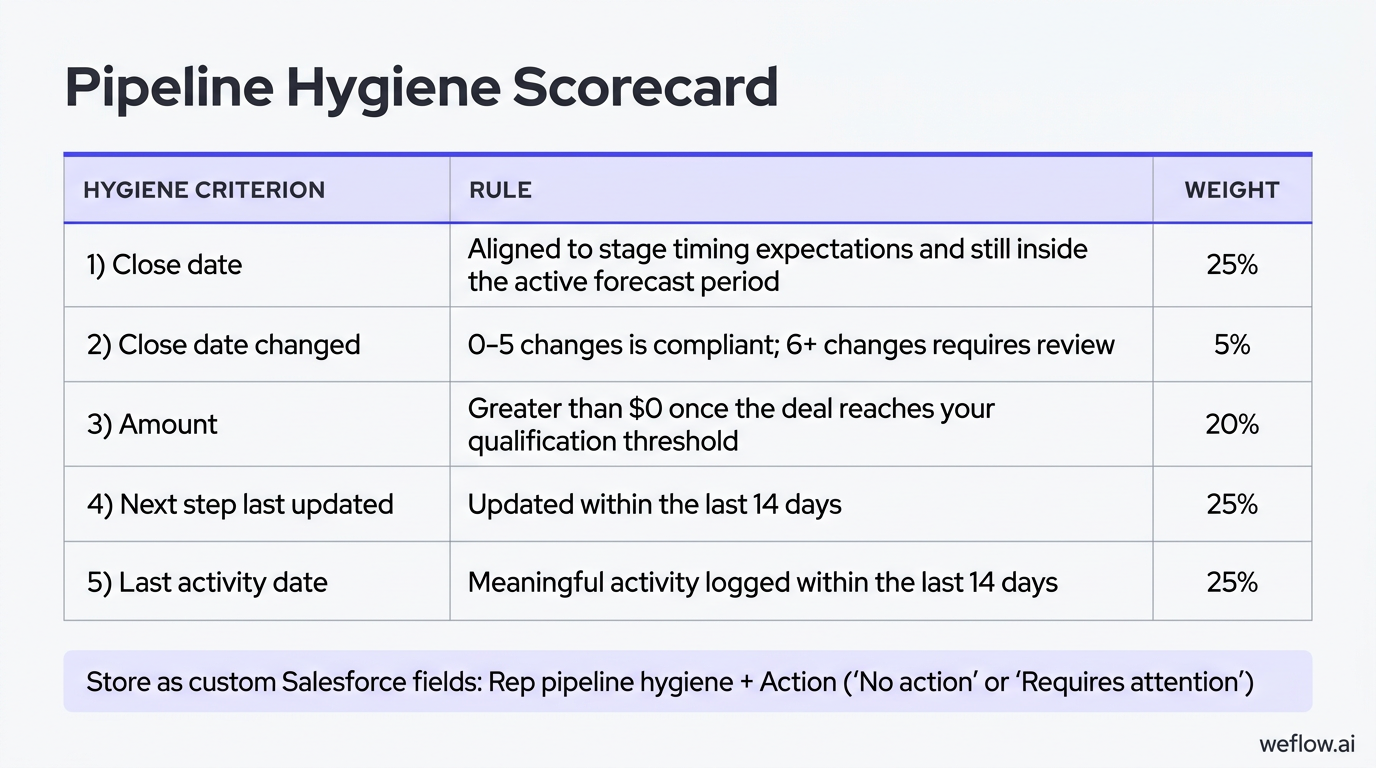
Pipeline hygiene gets better when you make it measurable. Start with clear team standards, send pre-review hygiene reminders, and calculate a score reps and managers can see before the weekly forecast review.
| Hygiene criterion | Rule | Weight |
|---|---|---|
| Close date | Aligned to stage timing expectations and still inside the active forecast period | 25% |
| Close date changed | 0-5 changes is compliant; 6+ changes requires review | 5% |
| Amount | Greater than $0 once the deal reaches your qualification threshold | 20% |
| Next step last updated | Updated within the last 14 days | 25% |
| Last activity date | Meaningful activity logged within the last 14 days | 25% |
Most teams store this as a custom Salesforce field such as Rep pipeline hygiene, plus an Action field for “No action” or “Requires attention.” Use that score in one-on-ones to focus inspection. A manager should ask why a rep is carrying seven late-stage deals with stale next steps—not use the score as a penalty without context.
Forecast parameters: align periods and metrics to sales cycles
Before you decide how to forecast, decide what number you’re forecasting and over what period. Teams often mix bookings, ARR, and recognized revenue into the same conversation, then wonder why the forecast doesn’t match the board deck or finance plan.
| Metric | Definition | Best fit for sales forecasting |
|---|---|---|
| Bookings | Contract value signed in a specific period | Useful when sales is measured on signed contract value by month or quarter |
| ARR | Annual recurring revenue associated with a deal, often stored as a Salesforce field | Useful for SaaS teams that want a normalized way to compare contract values |
| Recognized revenue | Revenue recorded over time as the service is delivered | Usually owned by finance, not the sales forecast |
Most SaaS companies forecast bookings or ARR because those numbers map to what sales can actually influence. Recognized revenue depends on billing terms, delivery timing, and accounting treatment—important for finance, but not the cleanest operating target for frontline sales teams.
Match forecast cadence to average deal length
Your cadence should reflect how fast deals move.
- SMB: 7-30 day sales cycle—weekly to monthly forecasting
- Mid-market: 30-90 day sales cycle—monthly to quarterly forecasting, with weekly inspection
- Enterprise: 90+ day sales cycle—monthly to quarterly forecasting, with weekly risk reviews
If you force enterprise managers to re-call every large deal every few days, you create admin work without adding signal. For longer cycles, keep weekly reviews focused on deal movement, slippage, and risk—not full forecast re-creation.
Forecast categories: map CRM stages to close probabilities
Forecast categories give the sales org a shared language for likelihood to close. In Salesforce, the categories teams usually manage for open opportunities are Pipeline, Best Case, and Commit, while Closed sits outside the active forecast call.
| Category | Definition | Minimum evidence |
|---|---|---|
| Pipeline | Open opportunities that are still active but not close enough for upside or commit | Qualified deal, active next step, and real buyer engagement |
| Best Case | Likely to close in-period, but risk remains | Commercial alignment exists, but timeline, procurement, or buying committee approval is still open |
| Commit | Expected to close in-period with high confidence | Economic buyer support, procurement advanced, clear timeline, and no unresolved blocker that would move the close date |
The mistake isn’t just bad category definitions. It’s letting reps move stages or categories without proof. If “Commit” only means “the rep feels good,” your commit number will always be high on Monday and lower by Friday. Tight criteria prevent happy ears from turning into forecast misses.
Revenue segmentation: run multiple forecasts for accuracy
One forecast for all revenue lines is usually too blunt to be useful. New logo, expansion, and renewal motions run on different teams, different cycle lengths, and different signals, so they need separate models and separate review logic.
| Revenue line | What it includes | Primary forecast drivers |
|---|---|---|
| New logo | Bookings from first-time customers | Pipeline creation, stage conversion, sales cycle length, and rep execution |
| Expansions | Upsell, cross-sell, seat growth, or second-product sales to existing customers | Product adoption, account engagement, customer health, and budget timing |
| Renewals | Contract renewals for existing customers | Renewal date, usage trends, support history, stakeholder sentiment, and commercial risk |
Expansion and renewal forecasts depend less on classic opportunity stages and more on customer signals. If you forecast them using only stage probability, you’ll miss churn risk, budget cuts, or product adoption issues that don’t show up in a standard new logo pipeline.
Forecasting methodologies: combine models to reduce bias
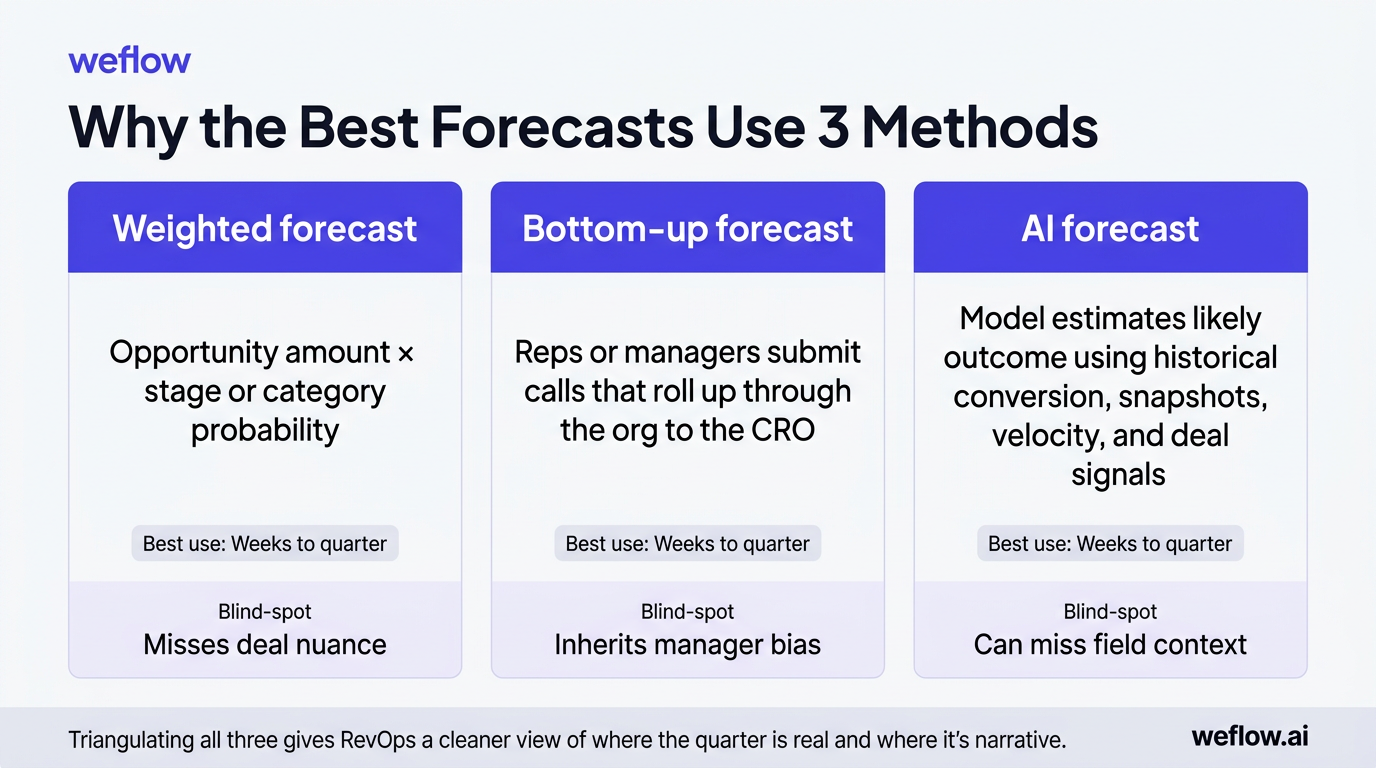
The most accurate teams don’t rely on one forecast model. They compare a weighted pipeline, a bottom-up manager call, and an AI forecast built from historical patterns and pipeline movement. Each model catches a different failure mode.
| Method | How it works | Best use timeframe |
|---|---|---|
| Weighted forecast | Opportunity amount multiplied by stage or category probability | Weeks to quarter |
| Bottom-up forecast | Reps or managers submit calls that roll up through the org to the CRO | Weeks to quarter |
| AI forecast | Model estimates likely outcome using historical conversion, snapshots, velocity, and deal signals | Weeks to quarter |
If you use only one method, you create a blind spot. Weighted forecasts miss deal nuance, bottom-up calls inherit manager bias, and AI can miss context that only the field knows. Triangulating all three gives RevOps a cleaner view of where the quarter is real and where it’s narrative.
Apply data-backed weights to opportunity stages
The basic weighted formula is straightforward: opportunity amount × close probability = weighted forecast value. The problem is that most teams hard-code probabilities once, then forget to revisit them as win rates change.
- Discovery — 10%
- Demo — 20%
- Value alignment — 35%
- Proposal — 60%
- Negotiation — 90%
- Closed Won — 100%
Those percentages are a starting point, not a truth. A better approach is to recalculate stage probabilities from the last six or 12 months of won and lost data—ideally by segment, product, and region. That accounts for seasonality, pricing changes, and shifts in buyer behavior better than a single static number set two fiscal years ago.
Integrate AI predictions with bottom-up calls
AI is most useful as a second opinion, not a replacement for the manager forecast call. It can compare what the field submitted against what the data suggests should happen based on similar deals and recent pipeline movement.
- Deal velocity and time in stage
- Stage conversion trends by segment
- Close date movement and slip patterns
- Activity completeness and stakeholder engagement
- Pipeline coverage and pacing against target
- Historical forecast accuracy by rep and manager
When the AI model and the manager call diverge, that’s your inspection queue. The point isn’t to overrule the manager automatically. It’s to surface which deals need deeper review before they surprise the CRO.
Operating cadence: structure the weekly bottom-up process
Forecasting works when it’s a recurring operating cadence, not a last-minute meeting. The goal is to collect calls, inspect the pipeline, lock the number, and spend executive time on actions instead of reconciliation.
| Role | Monday | Tuesday | Wednesday | Thursday | Friday |
|---|---|---|---|---|---|
| CRO | Forecast meeting with managers, RevOps, and cross-functional leaders | Executive review and decision follow-up | |||
| RevOps | Analyze pipeline, pacing, and risk; prepare inspection questions | Capture action items and owner assignments | Follow up on prior-week actions | ||
| Managers | Review rep submissions, inspect deals, and adjust calls | ||||
| Reps | Submit forecast call and update pipeline hygiene items | ||||
| Forecast tool | Lock prior period, capture snapshots, calculate pacing | Send submission reminders | Send hygiene and inspection reminders | Send final submission reminder before exec review | Roll up numbers and record manager changes |
Lock the forecast at a specific cutoff time—such as Wednesday 6 p.m. local or Thursday 9 a.m. before the exec meeting. If managers can keep editing the number during the review, you aren’t discussing one forecast. You’re discussing a moving target.
Schedule daily actions for reps and managers
| Every rep | Managers & higher |
|---|---|
| More frontline ownership of pipeline, better process compliance, and more data on call quality by rep | Less overhead and faster rollout when the org is early in forecast maturity |
| Works best when hygiene is already strong and required fields are enforced in Salesforce | Works best when data quality is still uneven and managers need to normalize calls first |
| Higher admin load if reps still update opportunities late | Less visibility into how managers changed frontline expectations unless overrides are tracked |
If your Opportunity data is still inconsistent, start with manager-only forecasting. Once pipeline hygiene is stable and activity completeness is high, expand call submission to every rep.
Forecast roll-ups: track manager adjustments across teams
A clean roll-up should show how the number moves from rep to manager to CRO, and why. If you can’t explain where the changes came from, you can’t improve forecast accuracy over time.
- Roll up forecast calls by role hierarchy
- Roll up by product line, business unit, or territory
- Compare each rolled-up call against quota, closed-won, open pipeline, and pacing
- Track week-over-week and month-over-month movement in the number
- See which specific deals are driving a manager’s call
- Separate raw rep call, manager-adjusted call, and final executive view
Coverage ratio matters here. A manager with a $1.2M commit against a $1M target and only $1.4M in open late-stage pipeline is operating with almost no room for slip. The roll-up isn’t just a sum. It’s a test of whether the pipeline can support the call.
Include or exclude specific deals from calls
Deal-level inclusion is better than blanket percentages. When managers choose exactly which opportunities sit inside the forecast call, they have to inspect the deal instead of guessing a total. That also gives RevOps a clean record of which deals drove the number each week.
Log manager overrides to maintain accountability
Track whether managers adjusted the call up or down, require an adjustment note, and preserve snapshots of the pre- and post-override number. Native Salesforce forecasting doesn’t give most teams enough traceability here, which is why RevOps often ends up building workarounds outside the platform. That’s fragile. A system that records overrides directly against the forecast submission gives you a way to spot which leaders consistently overcall and which leaders sandbag.
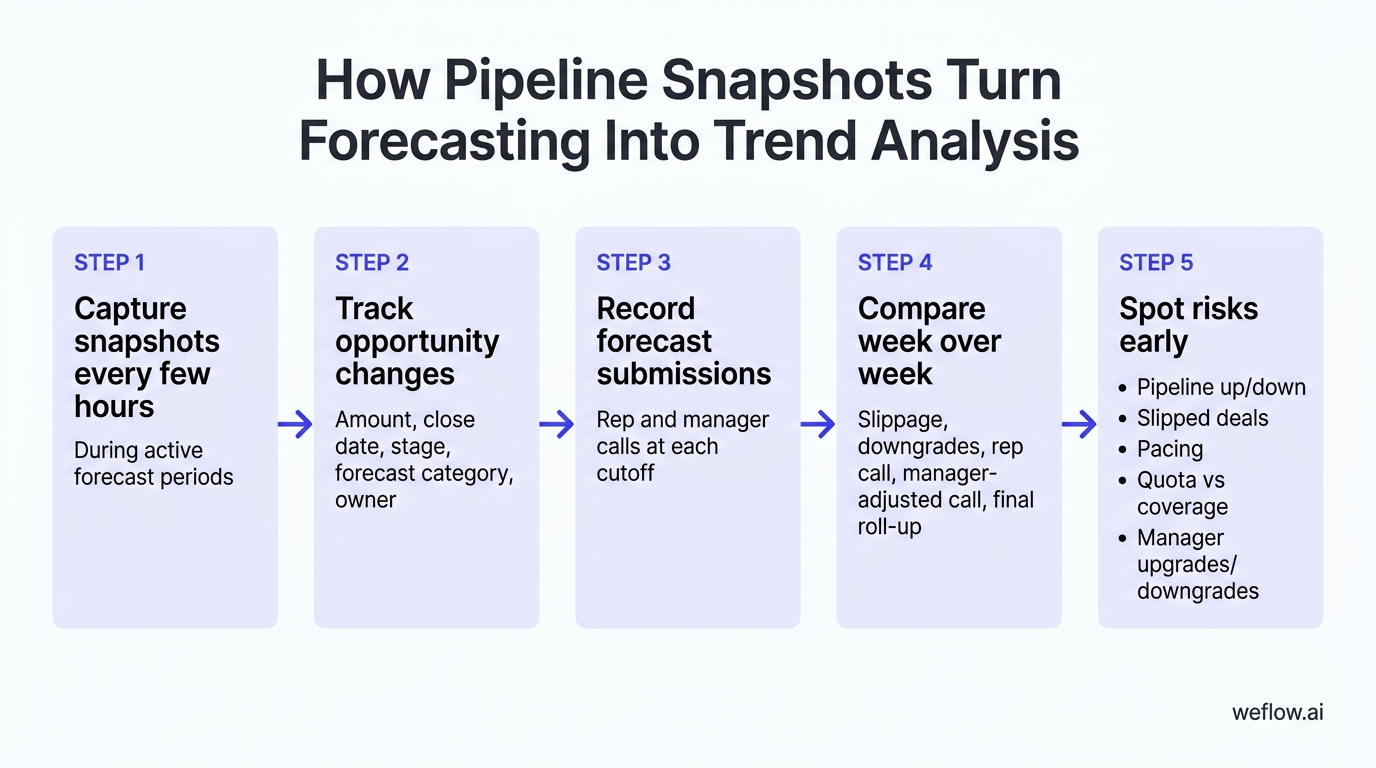
Pipeline snapshots: monitor deal changes to spot risks early
Snapshots are how you turn forecasting from opinion into trend analysis. You need historical records of how opportunities changed over time—not just their current state on the Opportunity object. Without that, close date slip, amount reductions, and forecast category movement disappear every time a field is overwritten.
| Why track | What to track | How to implement |
|---|---|---|
| See deal changes week over week | Opportunity count, amount, stage, forecast category, and close date | Use snapshot storage in Salesforce, a warehouse such as BigQuery or Redshift, or a purpose-built forecast system |
| Identify slippage into the next month or quarter | Close date changes and forecast category downgrades | Capture records on a recurring schedule and compare each point-in-time version |
| Track forecast movement over time | Rep call, manager-adjusted call, final rolled-up amount | Store forecast submissions and override history outside spreadsheet tabs |
You can do some of this natively, but not elegantly. Salesforce Reporting Snapshots are limited and often too slow for active forecast management. Purpose-built systems are easier because they capture changes every few hours, write forecast data back to Salesforce, and reduce the integration footprint. Tools such as Weflow, a Salesforce-native revenue AI platform, are designed for this model and typically deploy in weeks, not quarters.
Capture opportunity data at regular intervals
- Create opportunity snapshots every few hours during active forecast periods.
- Track changes to amount, close date, stage, forecast category, and owner.
- Record rep and manager forecast submissions at each cutoff.
- Measure forecast accuracy by rep and manager across prior periods.
Frequent snapshots stop last-minute cleanup from hiding risk. If a rep pushes five deals out the morning of the pipeline review, you should still see what the quarter looked like the day before.
Analyze week-over-week pipeline fluctuations
- How much open pipeline increased or decreased week over week by segment, region, and team?
- Which deals slipped out of the current forecast period, and were they in Commit, Best Case, or Pipeline?
- Is the team’s current call ahead of or behind pacing for the month or quarter?
- How does quota attainment compare with remaining open pipeline and current coverage ratio?
- Which managers are upgrading or downgrading calls most often?
For example, if enterprise pipeline drops 18% week over week because three large deals slipped into next quarter, the CRO can respond early—shift marketing spend toward late-stage pipeline creation, pull forward executive sponsor activity, or reset the commit before board reporting forces the conversation.
FAQ
How do you calculate sales forecast accuracy?
Forecast accuracy = (Actual Sales / Forecasted Sales) × 100. Measure it at both the rep and team level so you can see whether misses come from one manager’s call quality or from a broader pipeline problem. Most strong teams aim to land within 5-10% of their forecast call by period close.
What is a bottom-up sales forecasting model?
A bottom-up model starts with calls from the field—usually reps or frontline managers—and rolls them up through leadership to the CRO. It’s different from top-down forecasting, where leadership starts with the target and pushes a number downward whether the pipeline supports it or not.
Why do sales teams use weighted pipelines?
Weighted pipelines turn open opportunity value into a more realistic estimate by applying close probabilities to each deal. That gives RevOps a mathematical baseline before manager judgment enters the process. The model works best when probabilities are recalculated from recent Salesforce win rates instead of left static.
How often should managers review forecasts?
Managers should review active pipeline weekly and run a deeper trend review monthly. Weekly reviews catch slippage, stale next steps, and category changes in time to act, while monthly reviews help you recalibrate stage weights, coverage assumptions, and rep call quality. Consistency matters more than adding more meetings.


.webp)
.webp)
.avif)