Strategic Revenue Planning That Builds Accurate Forecasts and Headcount Models [Framework]
Board targets usually start as ambition. Revenue plans fail when that ambition isn’t tied to hiring capacity, pipeline creation, retention risk, and the actual pace of execution in Salesforce.
That gap is where RevOps matters. This framework shows how to turn top-down targets into bottom-up headcount models, risk-adjusted pipeline plans, and forecasts your CRO and board can trust.
[banner type="download" url="https://www.weflow.ai/content/strategic-revenue-planning-cheat-sheet" text="Strategic Revenue Planning Cheat Sheet" subtitle="Annual planning framework, capacity model, and forecasting checklist for revenue targets." button="Get it free"]Revenue planning inputs that align targets with reality
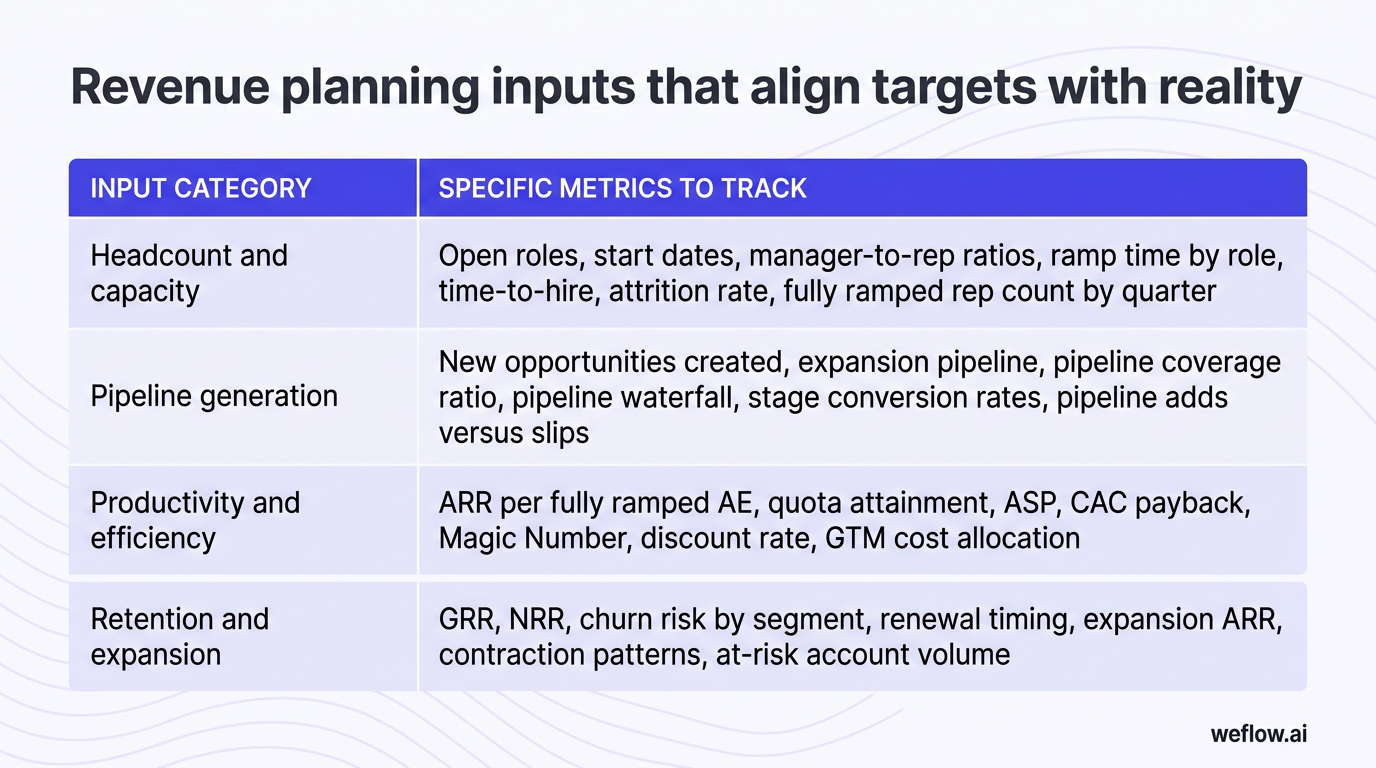
A realistic revenue plan starts with a small set of input categories that connect revenue goals to operating capacity. If one of these inputs is weak or missing, the model looks sound in a spreadsheet but breaks in quarter.
| Input category | Specific metrics to track |
|---|---|
| Headcount and capacity | Open roles, start dates, manager-to-rep ratios, ramp time by role, time-to-hire, attrition rate, fully ramped rep count by quarter |
| Pipeline generation | New opportunities created, expansion pipeline, pipeline coverage ratio, pipeline waterfall, stage conversion rates, pipeline adds versus slips |
| Productivity and efficiency | ARR per fully ramped AE, quota attainment, ASP, CAC payback, Magic Number, discount rate, GTM cost allocation |
| Retention and expansion | GRR, NRR, churn risk by segment, renewal timing, expansion ARR, contraction patterns, at-risk account volume |
Most board blind spots come from over-weighting one input. A plan built on pipeline volume alone ignores whether that pipeline converts efficiently. A plan built on rep quotas alone ignores whether the team will exist, ramp on time, and stay long enough to carry those quotas. A plan built on expansion alone can hide a weak new logo engine until it’s too late to correct.
Track headcount and capacity metrics
Hiring velocity sets the outer limit of revenue potential. If your hiring plan slips, your revenue plan slips with it—even if pipeline targets stay unchanged.
- Hiring plan by role and segment: Track approved headcount, open requisitions, expected start dates, and whether capacity is allocated to SMB, mid-market, or enterprise motions.
- Manager-to-rep ratio: Monitor span of control so front-line managers can still inspect deals, coach reps, and run a usable bottom-up forecast process.
- Modeled ramp time: Document the planned ramp curve for each role, ideally by month, not just “fully ramped in six months.”
- Actual ramp time: Compare modeled ramp to actual productivity in Salesforce by cohort, territory, and segment.
- Attrition buffer: Add expected rep churn into the capacity model so you’re planning on net productive headcount, not just approved seats.
- Active capacity by quarter: Measure how many reps are fully productive, partially ramped, or still pre-ramp in each quarter.
A simple example: if you planned to hire an enterprise AE in January but the rep starts in April, you haven’t lost only three months of salary timing. You’ve shifted the ramp curve. If that role typically takes nine to 12 months to reach full productivity, the rep may contribute little to Q4 commit instead of carrying a meaningful number. Multiply that by several enterprise hires, and the Q4 board plan can miss before Q1 even ends.
Avoid common revenue planning pitfalls
Most planning misses are predictable. They come from assumptions that look reasonable in annual planning and fail once hiring, pipeline quality, or retention starts moving against plan.
Late hiring and underestimated ramp time: This usually shows up when finance books capacity based on seat count while RevOps knows the real constraint is time-to-fill plus time-to-productivity. The business impact is a capacity shortfall that no pipeline push can fix in-quarter.
Over-assigned quotas: When leadership spreads the target across too few reps, attainment drops, rep burnout rises, and the forecast becomes a weekly argument about heroics instead of a measurable operating model.
Overreliance on expansion revenue: Expansion can help close a plan gap, but it’s risky if renewal timing, product adoption, or customer health data doesn’t support the assumption. Boards usually see through growth stories that depend too heavily on existing accounts.
Ignoring pipeline quality in favor of volume: A bloated pipeline can make coverage look healthy while stage conversion, time in stage, and deal activity all point the other way. If MEDDIC fields are incomplete, stage exit criteria are loose, or opportunity hygiene is inconsistent in Salesforce, volume alone won’t protect the forecast.
No scenario planning: A single number tells leadership what you hope happens. A scenario model tells leadership what happens if win rates soften, hiring slows, or pipeline creation misses for one quarter.
Fixing these issues requires more than better assumptions. It requires a structured capacity model that starts with real productivity data and then translates targets into hiring, pipeline, and timing requirements.
Capacity modeling: translate board goals into headcount
Capacity modeling is the workflow that turns board goals into an operating plan. The goal isn’t to produce a perfect number. It’s to make the assumptions explicit enough that RevOps, front-line managers, FP&A, and the CRO can see what must be true for the target to hold.
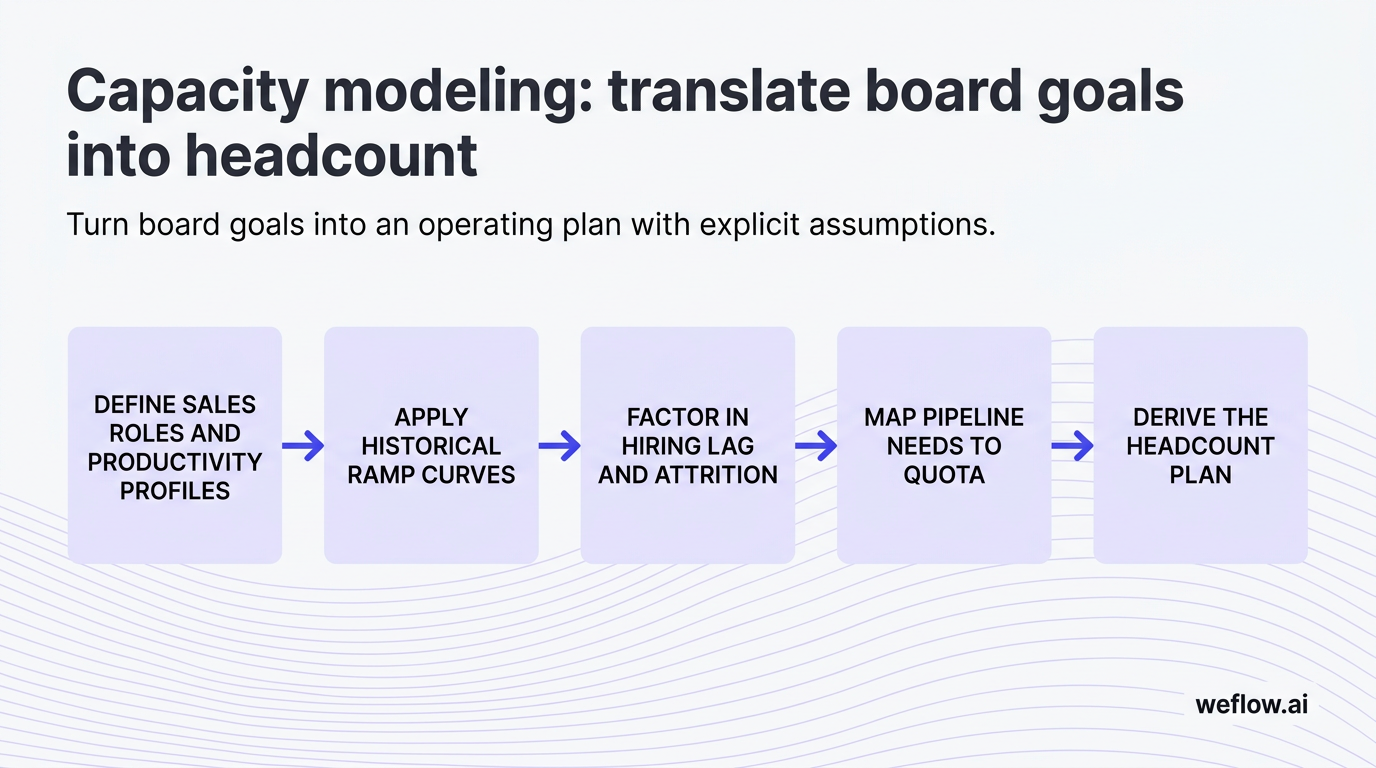
- Define sales roles and productivity profiles. Separate AEs, SDRs, CSMs, renewals teams, overlay specialists, and any segment-specific roles. Assign historical performance benchmarks to each role.
- Apply historical ramp curves. Use actual time-to-productivity by cohort and segment, not a single company-wide ramp assumption.
- Factor in hiring lag and attrition. Add time-to-hire, onboarding lag, and expected churn so the model reflects net productive capacity.
- Map pipeline needs to quota. Calculate required pipeline per rep based on quota and win rate, then aggregate by month or quarter.
- Derive the headcount plan. Compare required capacity to current productive headcount, then identify how many hires are needed and when they must start.
Front-line manager validation matters here. Sales managers know which territories are under-covered, which segments ramp slower, and where historical averages hide rep mix problems. If they don’t review the model before sign-off, you’ll get a clean spreadsheet and a weak execution plan.
Define distinct sales roles and profiles
- AEs: Split by segment or motion—SMB, mid-market, enterprise, commercial, strategic—if quotas, cycle length, and win rates differ.
- SDRs: Model sourced pipeline, meeting-to-opportunity conversion, and support ratios by team.
- CSMs and renewals: Treat retention and expansion as their own capacity problem with separate productivity assumptions.
- Historical performance metrics: Assign ARR per rep, average deal size, win rate, sales cycle length, and stage conversion based on actuals.
Blending enterprise and SMB productivity into one average ruins forecast accuracy. A rep with a 30-day cycle and a rep with a 10-month cycle should never share one ramp assumption, one coverage ratio, or one attainment benchmark.
Apply historical ramp curves by rep type
- Build monthly ramp percentages: Model productivity as a monthly curve, such as 0%, 15%, 35%, 55%, 75%, and 100%, instead of a single “full ramp” date.
- Weight by historical averages: Use cohort data from Salesforce bookings and opportunity history to ground each curve in actual outcomes.
- Split by role and segment: SDRs, SMB AEs, enterprise AEs, and renewals roles should each have their own curve.
- Review quarterly: Update the curves when onboarding, territory design, or market conditions change.
As a rule, SMB and mid-market roles often reach productivity in three to six months. Enterprise roles usually take nine to 12 months. If your model treats both as six-month ramps, your second-half forecast will look stronger than your actual selling capacity.
Pipeline coverage strategies that buffer against risk
Capacity alone doesn’t produce revenue. Reps need enough qualified pipeline, with enough time to move, to support quota. Pipeline coverage strategy is how RevOps makes sure the opportunity base is large enough—and healthy enough—to absorb normal volatility.
- Coverage ratio targets: Set pipeline-to-quota targets by segment and quarter so each team knows what volume is required to support commit.
- Marketing and SDR alignment: Translate pipeline targets into lead volume, meeting creation, and sourced opportunity requirements by month.
- Pipeline health monitoring: Track coverage, stage conversion, average time in stage, and activity completeness so volume isn’t mistaken for quality.
- Gap remediation: When coverage drops, identify whether the issue is low opportunity creation, poor qualification, weak progression, or deal slippage.
- Risk buffers: Add 10%–20% extra coverage where conversion rates swing quarter to quarter or deal timing is less predictable.
Win rates should dictate the coverage ratio. A flat 3x rule is easy to remember, but it’s wrong for many teams. If one segment closes at 33%, 3x coverage may be enough. If another closes at 20%, you need closer to 5x just to support the same revenue target before adding any risk buffer.
Build scenario plans for upside and downside
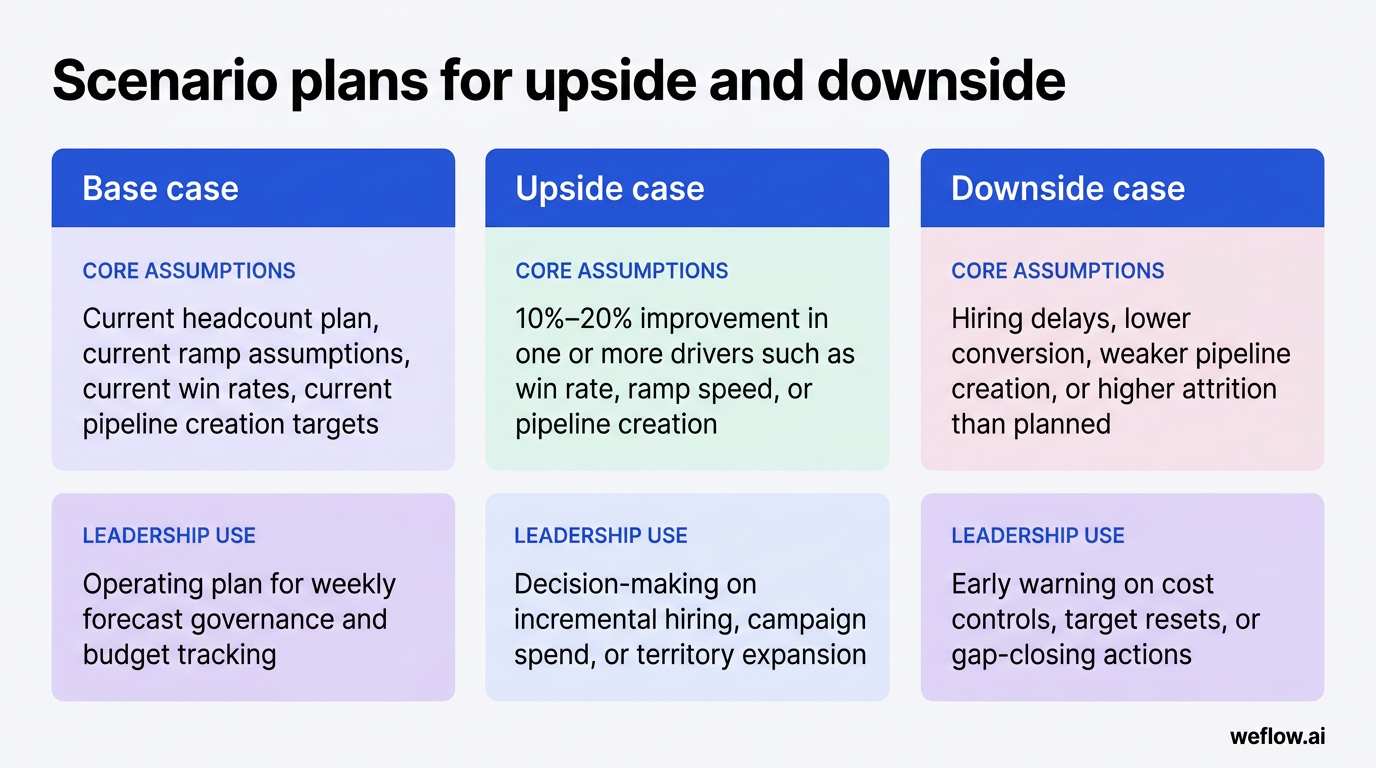
Scenario planning gives leadership a range tied to assumptions, not a single rigid number. That’s how RevOps builds board trust: by showing what changes the outcome, where the risk sits, and what actions are available before the quarter is lost.
| Scenario | Core assumptions | What leadership should use it for |
|---|---|---|
| Base case | Current headcount plan, current ramp assumptions, current win rates, current pipeline creation targets | Operating plan for weekly forecast governance and budget tracking |
| Upside case | 10%–20% improvement in one or more drivers such as win rate, ramp speed, or pipeline creation | Decision-making on incremental hiring, campaign spend, or territory expansion |
| Downside case | Hiring delays, lower conversion, weaker pipeline creation, or higher attrition than planned | Early warning on cost controls, target resets, or gap-closing actions |
The key is to change only the drivers that plausibly move. If you increase win rate, pipeline creation, and ramp speed all at once, the upside case stops being a scenario and becomes wishful thinking.
Forecasting methodologies that eliminate quarterly surprises
Forecasting works best when it starts simple. Most teams should begin with one method they can govern consistently, then add other methods as a validation layer. Over time, the strongest forecast process blends weighted forecasting, bottom-up manager rollups, and AI-based pattern detection into one operating view.
A good forecast also uses a rolling five-quarter lens. That forces the team to connect this quarter’s commit to the leading indicators that shape the next four—hiring, ramp, opportunity creation, stage progression, and retention risk.
Calculate weighted forecasts for early visibility
- How it works: Multiply each deal amount by the probability associated with its current stage.
- Quick example: A $100,000 deal in Proposal at 60% contributes $60,000 to the weighted forecast.
- Best use case: Early visibility when you need a simple baseline and don’t yet have a strong bottom-up discipline.
- Complexity and accuracy: Low complexity, low-to-medium accuracy.
- Common pitfalls: Unclear stage exit criteria, hard-coded probabilities, poor stage hygiene, and stage definitions that drift across teams.
The biggest risk is stale probability logic. If your Salesforce stage probabilities were set 18 months ago and win rates have since changed by segment, the weighted forecast will look mathematically clean and still be wrong.
Roll up bottom-up forecasts for high accuracy
- How it works: Reps and managers submit forecast calls weekly or bi-weekly, then roll those calls up by team and segment.
- What to weight on: Standard forecast categories such as pipeline, best case, commit, and closed, with clear definitions in Salesforce.
- Best use case: Quarter management when managers are inspecting deal risk and updating calls based on live opportunity data.
- Complexity and accuracy: Medium-to-high complexity, high accuracy when the process is governed well.
- Common pitfalls: Missing submissions, loose review cadences, weak deal inspection, and poor CRM hygiene.
Bottom-up forecasting depends on cultural accountability. Managers have to own the number, not just relay rep optimism upward. That means consistent forecast calls, clear commit definitions, and enough trust that call quality matters more than political pressure.
Layer AI forecasting for holistic deal insights
- How it works: Machine learning evaluates patterns such as deal velocity, historical rep accuracy, stage behavior, activity levels, and multivariate closed-won signals.
- Best use case: Secondary validation layer that flags outliers human reviewers may miss.
- Complexity and accuracy: High complexity, medium-to-high accuracy depending on data quality and process consistency.
- Common pitfalls: Black-box trust issues, weak Salesforce hygiene, incomplete activity capture, and process changes that make old patterns less useful.
AI forecasting should supplement—not replace—bottom-up manager reviews. If the human forecast says commit and the model says risk, that conflict is useful. It tells RevOps where to inspect activity gaps, deal stagnation, or rep bias.
This is also where architecture matters. If conversation data and activity signals sit outside Salesforce or write back with shallow field mapping, your model inherits those gaps. Many teams hit this limit with Gong because conversation intelligence is strong but Salesforce write-back often relies on narrower mappings and manual workarounds. Teams that move from Gong to Weflow, a Salesforce-native revenue AI platform, usually do it to improve activity completeness, reduce integration footprint, and keep forecasting logic closer to the Salesforce data model. In practice, that migration is usually measured in weeks, not quarters, which matters when RevOps is carrying the project plan.
Performance audits: find the data driving your revenue engine
Planning gets better when the next cycle starts with an audit of what actually happened. The point isn’t to produce more reporting. It’s to test whether the assumptions in your model still match reality across sales, marketing, and customer success.
| Audit type | Purpose | Key actions |
|---|---|---|
| Sales audit | Check whether rep productivity, ramp outcomes, and coverage assumptions held up | Review bookings by rep, territory, and segment; compare actual ramp curves to modeled curves; inspect quarter-end coverage and stage conversion; update win-rate and quota assumptions |
| Marketing audit | Measure campaign ROI and whether lead quality supports pipeline targets | Map leads from source to SQL to opportunity to closed-won; compare cost per opportunity by channel; review lead aging and conversion by segment |
| CS audit | Validate retention and expansion assumptions used in the revenue plan | Review GRR, NRR, churn drivers, renewal timing, expansion patterns, and at-risk cohorts; adjust renewal and expansion assumptions in the model |
| Integrated GTM reporting | Connect sales, marketing, and CS performance into one operating view | Publish shared dashboards, annotate drivers of variance, and present findings in one narrative to leadership |
A useful way to present these findings is the What–So What–Now What framework. What happened in the data. So what it means for revenue risk, capacity, or efficiency. Now what leadership should change in headcount, targets, coverage, or execution.
Track pipeline velocity and stage conversion
- Pipeline velocity: Measures how quickly qualified opportunity value moves through the funnel into revenue.
- Average time in stage: Shows where deals stall and where progression is slower than plan.
- Stage conversion rate: Tracks how often opportunities move from one stage to the next, helping identify leakage by segment or team.
- Pipeline waterfall: Shows the drivers of pipeline change over time, including adds, amount changes, slips, pulls, wins, and losses.
- Pipeline coverage: Compares current qualified pipeline to quota so you can see whether each team has enough opportunity volume.
- Forecast versus actuals: Measures forecast error rate and helps calibrate both stage probabilities and manager submissions.
These metrics should feed back into the capacity model. If velocity slows or stage conversion drops, the hiring plan may still be right while the revenue plan is no longer realistic. RevOps has to update the model when execution conditions change, not wait for annual planning to catch up.
Revenue governance: turn static plans into active playbooks
Revenue planning isn’t a once-a-year event. The real work is governance: comparing inputs versus actuals every week, adjusting assumptions every month, and re-forecasting before misses become surprises.
That means one operating cadence across RevOps, sales leadership, and finance. Review hiring progress, ramp cohorts, pipeline coverage, forecast categories, slips and pulls, retention risk, and forecast versus actuals in the same motion. If you keep these inputs tied back to Salesforce as the source of truth—with clean field mapping, clear validation rules, and consistent stage definitions—the forecast becomes easier to defend.
If your current process still depends on exported reports, manual Salesforce write-back, or patchwork data coming from Gong into separate planning sheets, treat that as governance risk. RevOps teams usually get better outcomes when activity capture, conversation signals, forecasting, and analytics live in one Salesforce-native system with lower total cost of ownership. The byproduct isn’t just cleaner reporting. It’s a forecast grounded in real operating capacity.
FAQ
What is a good pipeline coverage ratio?
For many B2B teams, 3x to 4x is a starting benchmark, not a rule. The right ratio depends on win rate, deal timing, and segment mix. If a team wins 20% of qualified opportunities, it needs 5x coverage before adding any buffer for slippage—so a flat 3x target would understate risk.
How do you calculate sales capacity?
A simple version is: required pipeline per rep = quota ÷ win rate, then adjust for ramp time and attrition. To estimate active selling capacity, subtract hiring lead time and onboarding lag from the period you expect the rep to contribute. Approved headcount is not the same as productive capacity.
How do top-down and bottom-up forecasts differ?
Top-down forecasts start with the executive target the board wants to see. Bottom-up forecasts start with rep-level pipeline, manager judgment, and current operating conditions. The gap between those two numbers is where RevOps has to work—through hiring, coverage generation, target resets, or risk mitigation.
How often should you review revenue forecasts?
Weekly forecast calls are the right cadence for most mid-market and enterprise B2B organizations. Pair that weekly motion with a rolling five-quarter view so leadership can see not just whether this quarter is on track, but whether the drivers of next quarter and next year are still holding. Weekly discipline is what prevents end-of-quarter surprises.


.webp)
.webp)
.avif)