Chief Revenue Officer Metrics and Forecasts to Track Predictable Growth [Cheat Sheet]
The CRO’s job is simple to state and hard to execute: grow revenue efficiently, forecast it accurately, and keep the board confident in the number. That only happens when the revenue team runs on the right metrics, the right dashboards, and a forecast process grounded in clean Salesforce data.
This guide turns the cheat sheet into an operating playbook. You’ll see how strong CROs structure the revenue org, which metrics matter by stage, and how to build forecast views that help teams spot risk early instead of explaining misses at quarter end.
[banner type="download" url="https://www.weflow.ai/content/cro-cheat-sheet" text="Chief Revenue Officer Cheat Sheet" subtitle="Get CRO responsibilities, leadership skills, revenue planning frameworks, and pipeline forecasting checklists." button="Download now"]CRO foundations: align teams for predictable revenue growth
A CRO owns more than bookings. The role spans pipeline generation, conversion, retention, forecasting, and board reporting—so the operating model has to cover the full customer journey, not just the pre-sale funnel.
- Drive profitable and efficient revenue growth across new business, expansion, and retention.
- Set revenue strategy and planning by segment, region, product, and motion.
- Generate, convert, and forecast pipeline with clear stage definitions and inspection cadence.
- Optimize the customer journey from first touch through onboarding, renewal, and expansion.
- Align the revenue team across Marketing, Sales, Customer Success, and RevOps.
- Build, scale, and retain the revenue team through hiring, enablement, performance management, and coaching.
- Forecast and report to executives and the board with clear commit logic and variance tracking.
- Build a customer-centric culture that ties product value to commercial outcomes.
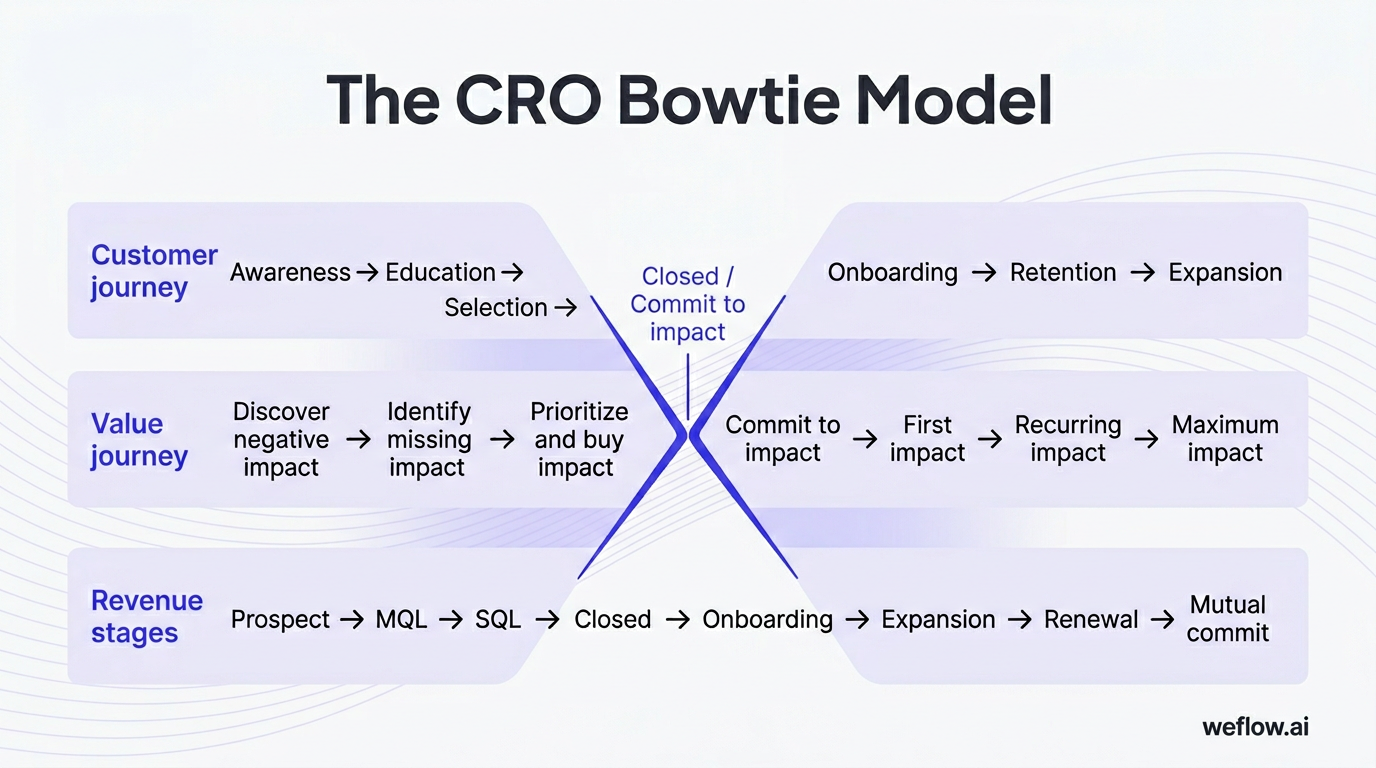
The traditional funnel is outdated because it treats closed-won as the finish line. In recurring revenue businesses, closed-won is the midpoint. The bowtie model is a better operating map because it shows where revenue is won, retained, and expanded.
Bowtie model
Customer journey: Awareness → Education → Selection → Onboarding → Retention → Expansion
Value journey: Discover negative impact → Identify missing impact → Prioritize and buy impact → Commit to impact → First impact → Recurring impact → Maximum impact
Revenue stages: Prospect → MQL → SQL → Closed → Onboarding → Expansion → Renewal → Mutual commit
Map the revenue organization structure
The cleanest structure puts the CRO directly under the CEO and gives that role authority across the full revenue engine.
- CEO
- CPO
- Product
- CRO
- VP, Marketing
- Demand Gen
- Content Marketing
- Field Marketing
- Product Marketing
- Partner Marketing
- VP, Sales
- By segment
- By geo
- By product
- Outbound
- Partnerships
- VP, Customer Success
- By segment
- By geo
- By product
- By function
- Support
- VP, RevOps
- Marketing Ops
- Sales Ops
- CS Ops
- Enablement
- Systems
- VP, Marketing
- CFO
- FP&A
- CPO
RevOps should sit as a peer to Sales, Marketing, and Customer Success—not as a support function buried under one team—because it owns process design, Salesforce governance, data completeness, and reporting logic across the full revenue lifecycle.
Master essential cross-functional skills
A modern CRO needs leadership range, financial judgment, and enough systems fluency to challenge bad data before it turns into a bad forecast.
| Leadership skills | Business skills | Technical skills |
|---|---|---|
| Executive presence, change management, cross-functional leadership, strategic thinking, team building, decision-making under uncertainty | Market analysis, financial planning, risk management, business strategy, contract negotiation, competitive intelligence | Hiring, data analysis, sales tech stack management, financial modeling, sales methodology, revenue operations systems |
In practice, these skills show up together. A CRO might notice in Salesforce that stage-two-to-stage-three conversion dropped 12% in EMEA, then use that data in a manager coaching session to tighten discovery standards, reset qualification rules, and rebalance pipeline targets before the next board update.
GTM strategies: overcome scaling roadblocks to $100M ARR
Different go-to-market motions need different investments. The mistake most teams make is copying an enterprise playbook into a mid-market motion—or vice versa—then wondering why CAC payback and win rates drift in opposite directions.
| Strategy | Characteristics | Investment areas | Success metrics |
|---|---|---|---|
| Enterprise | $100K+ ACV, 6+ month cycles, multiple stakeholders, customization, high-touch implementation | Field sales, solutions engineering, security and compliance, enterprise features, professional services, executive relationships | Average deal size, enterprise logo acquisition, security certification completion, services revenue, reference customers |
| Mid-market | $25K-$100K ACV, 2-4 month cycles, more standardized offering, mix of high-touch and tech-touch | Sales development, partner enablement, product standardization, self-serve resources, automated onboarding | Sales cycle length, CAC payback, win rate, GRR, NRR, product usage |
| Product-led growth | Lower initial ACV, self-serve motion, short time to value, expansion potential, usage signals matter | Product experience, self-serve flows, growth engineering, usage analytics, automated expansion plays | Time to first value, activation rate, expansion revenue, user engagement, viral coefficient |
| Partner-led | Indirect sales, geographic reach, industry specialization, shared economics | Partner portal, training, co-marketing, channel operations, partner support | Partner-sourced revenue, partner satisfaction, channel conflict rate, program ROI, geographic coverage |
| Hybrid | Multiple motions by segment, product, or region, flexible buyer paths, blended revenue streams | Segment operations, team coordination, systems integration, attribution logic, cross-functional process design | Segment performance, motion efficiency, blended CAC, resource allocation, overall growth rate |
Most companies move toward a hybrid model as they approach $100M ARR. That’s not because hybrid is fashionable. It’s because buyer behavior fragments: some accounts want self-serve, some want sales assist, and enterprise buyers still expect a high-touch motion with security, procurement, and executive alignment.
Fix common pipeline and conversion bottlenecks
Growth usually stalls at a small number of operating constraints. Find the one that is limiting output now, fix it, then move to the next.
| Problem | What to do |
|---|---|
| Pipeline coverage is low | Shift investment into pipeline generation, improve MQL-to-SQO conversion, and test new channels or segments before next-quarter coverage drops below target. |
| Win rates are low | Tighten discovery, improve objection handling, and review competitive loss reasons by segment instead of using one generic battlecard. |
| Quota attainment is weak | Improve hiring quality, shorten ramp with better enablement, and address consistent underperformance early. |
| Deal quality is inconsistent and visibility is poor | Automate activity capture into Salesforce, enforce qualification fields, require next step and next meeting date, and run regular pipeline inspections. |
| Sales cycles are too long | Map pain to business impact earlier, identify approval blockers sooner, and drive urgency with clear mutual action plans. |
| Forecasts are inaccurate | Run a weekly forecast cadence, combine forecast methods, and track forecast versus actuals by manager and team. |
| CAC payback is too high | Break down CAC by channel and segment, cut spend on weak sources, and align incentives to revenue quality instead of top-of-funnel volume alone. |
| Rep turnover is high | Define the ideal rep profile, analyze what top performers do differently, and rebuild hiring around those inputs. |
If you’re earlier in the growth curve, fix pipeline coverage first—without enough volume, every other improvement has limited effect. If you already have enough pipeline, focus on win rate, sales cycle length, or forecast accuracy based on where the biggest revenue gap sits today.
Revenue metrics: track health across the customer journey
CROs need two views of performance at the same time: growth metrics that show whether the company is expanding, and health metrics that show whether that growth is durable. Efficiency metrics sit between them and answer the board’s hardest question: are you buying growth at a reasonable cost?
These categories serve different audiences. Boards care about ARR growth, burn multiple, Rule of 40, and retention. Frontline managers care about coverage, conversion, stage aging, and ramp time. RevOps has to connect the two views inside Salesforce so leadership can move from an executive metric to the operational driver behind it.
Monitor investor and financial health metrics
Market conditions change what investors prioritize. When capital is cheap, growth gets more room. When budgets tighten, burn multiple, runway, gross margin, and CAC payback move to the center of the board conversation.
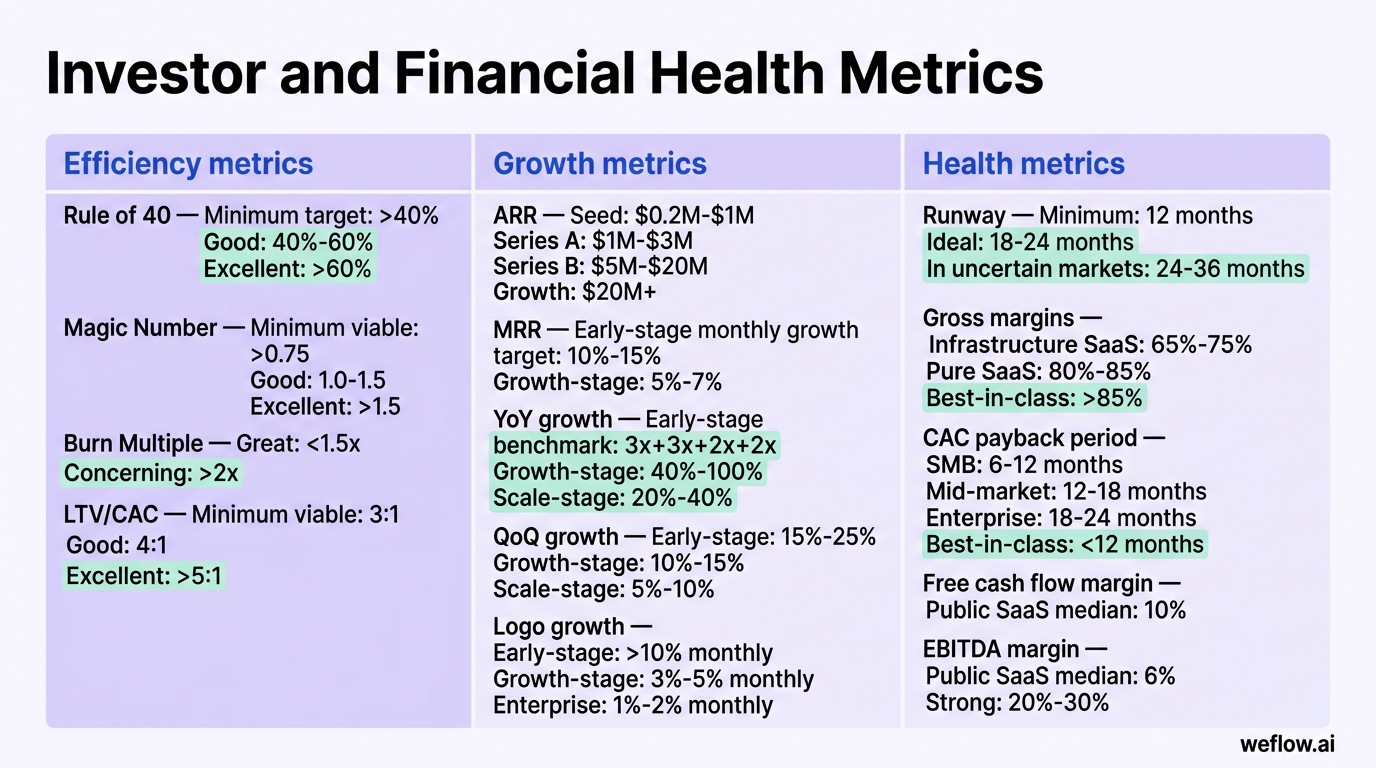
- Efficiency metrics
- Rule of 40: YoY revenue growth rate + EBITDA margin. Minimum target: >40%. Good: 40%-60%. Excellent: >60%.
- Magic Number: Net new ARR divided by previous quarter sales and marketing spend. Minimum viable: >0.75. Good: 1.0-1.5. Excellent: >1.5.
- Burn Multiple: Net burn divided by net new ARR. Great: <1.5x. Concerning: >2x.
- LTV/CAC: Minimum viable: 3:1. Good: 4:1. Excellent: >5:1.
- Growth metrics
- ARR: Stage benchmark varies—Seed: $0.2M-$1M, Series A: $1M-$3M, Series B: $5M-$20M, Growth: $20M+.
- MRR: Early-stage monthly growth target: 10%-15%. Growth-stage: 5%-7%.
- YoY growth: Early-stage benchmark: 3x+3x+2x+2x. Growth-stage: 40%-100%. Scale-stage: 20%-40%.
- QoQ growth: Early-stage: 15%-25%. Growth-stage: 10%-15%. Scale-stage: 5%-10%.
- Logo growth: Early-stage: >10% monthly. Growth-stage: 3%-5% monthly. Enterprise: 1%-2% monthly.
- Health metrics
- Runway: Minimum: 12 months. Ideal: 18-24 months. In uncertain markets: 24-36 months.
- Gross margins: Infrastructure SaaS: 65%-75%. Pure SaaS: 80%-85%. Best-in-class: >85%.
- CAC payback period: SMB: 6-12 months. Mid-market: 12-18 months. Enterprise: 18-24 months. Best-in-class: <12 months.
- Free cash flow margin: Public SaaS median: 10%.
- EBITDA margin: Public SaaS median: 6%. Strong: 20%-30%.
Track marketing and sales pipeline efficiency
Marketing quality shows up later as sales efficiency. If MQL scoring is weak, SQL conversion drops, sales cycles stretch, and win rates fall because reps are carrying volume instead of real buying intent.
| Metric | Definition | Benchmark |
|---|---|---|
| MQL to SQL conversion rate | Percentage of marketing qualified leads that convert to sales qualified leads. | 15%-30% for B2B SaaS |
| Cost per MQL | Total marketing spend divided by MQL volume. | $30-$100 |
| Lead scoring effectiveness | Share of MQLs that meet minimum scoring thresholds and are accepted by sales. | >60% of MQLs should convert to SALs |
| MQL response time | Average time for sales to respond to a new MQL. | <1 hour |
| Pipeline coverage ratio | Total open pipeline divided by revenue target for the period. | 3x-4x for enterprise, 5x-6x for mid-market |
| Pipeline velocity | (Number of deals × average deal size × win rate) / sales cycle length. | Healthy pipelines usually keep stagnant deals below 20% |
| Win rate | Closed-won deals divided by total closed deals. | 20%-30% overall, >35% for top performers, 15%-25% in enterprise |
| Sales cycle length | Average time from first meaningful contact to close. | 1-3 months for SMB, 3-6 months for mid-market, 6-12+ months for enterprise |
| SQL conversion rate | Percentage of SQLs that become customers. | 20%-30%, with >35% for top performers |
| Ramp time | Time for a new rep to reach expected productivity. | SDRs: 3-4 months, AEs: 6-9 months, Enterprise AEs: 9-12 months |
| Sales capacity utilization | Share of available time spent on revenue-generating work. | >60% for top performers, 35%-45% industry average |
Operational note for RevOps: these numbers only hold up if activity completeness is high inside Salesforce. If emails, meetings, and call outcomes sit in separate systems with shallow field mapping or limited write-back, stage conversion and pipeline velocity get distorted fast.
Measure customer success and retention rates
Recurring revenue turns retention into a core CRO metric, not a CS-only metric. That’s why strong CROs track onboarding, adoption, renewal risk, and expansion in the same operating rhythm as pipeline generation.
| Metric | Definition | Benchmark |
|---|---|---|
| Time to first value | Time between purchase and the customer reaching the first meaningful outcome. | Days to weeks for SMB, 1-3 months for enterprise |
| Product adoption rate | Share of purchased features or modules actively used. | >60% is good, >80% is best-in-class |
| Customer churn rate | Percentage of customers that cancel or fail to renew. | 3%-5% monthly for SMB, <1% monthly for enterprise, <5% annually for best-in-class |
| Revenue churn rate | Percentage of recurring revenue lost from existing customers. | 5%-7% annually for SMB, <5% annually for enterprise |
| Net revenue retention (NRR) | Revenue retained from existing customers including expansion, less contraction and churn. | >100% is good, >110% is great, >120% is best-in-class |
| Gross revenue retention (GRR) | Revenue retained from existing customers excluding expansion. | >85% is good, >90% is great, >95% is best-in-class |
| NPS | Likelihood to recommend, measured as promoters minus detractors. | 30-40 for B2B SaaS, >50 for top performers |
| CSAT | Satisfaction with a specific interaction or support experience. | 75%-85% is common, >90% for top performers |
| Support resolution time | Average time to resolve support tickets. | First response <4 hours, resolution <24 hours |
| Expansion revenue | Revenue added through upsell, cross-sell, or increased usage. | 20%-30% of total revenue, with >40% at top performers |
NRR is often the cleanest indicator of product-market fit because it reflects whether customers keep buying more after they’ve experienced the product. You can close a lot of new logos with a strong sales motion. You usually can’t sustain NRR above 120% without real customer value.
Pipeline forecasting: build dashboards that predict revenue
Forecasting breaks when leadership is surprised by information the field already had but never surfaced clearly. That problem gets worse when markets are volatile, buying cycles stretch, and small changes in win rate or cycle time have outsized impact on the quarter.
Dashboards help only when the underlying Salesforce data is reliable. That means enforced stage exit criteria, required next step and next meeting fields, consistent forecast categories, and weekly opportunity snapshots. If your forecasting layer can’t sit on top of Salesforce in weeks, not quarters, total cost of ownership starts working against you before the model even goes live.
Implement essential pipeline visibility dashboards
-
Stage conversion dashboard
Track how many opportunities move from one stage to the next and where conversion breaks down. This tells managers where to coach—discovery, value alignment, proposal, or procurement—instead of running a generic pipeline review. -
Average time in stage dashboard
Measure how long deals spend in each stage and flag aging opportunities against expected thresholds. In Salesforce, this works best when stage changes are tracked consistently and close-date pushes are visible over time. -
Win rate dashboard
Break win rate out by segment, source, rep, competitor, and stage reached. A single blended win rate hides useful detail—especially when enterprise and mid-market motions behave differently. -
Pipeline coverage dashboard
Compare current and future-quarter pipeline against target. This is the fastest way to see whether next quarter’s number is already at risk before the quarter even starts. -
Forecast versus actuals dashboard
Show commit, best case, and closed outcomes by team and manager, then calculate error rate. This is where forecast discipline becomes measurable rather than anecdotal. -
Pipeline waterfall dashboard
Track what changed week over week: new pipeline created, deals pulled in, deals slipped, deals lost, and amount changes on existing opportunities. In a Monday leadership meeting, a CRO can use this view to separate a volume problem from a movement problem. If the number dropped because deals slipped two stages and pushed 30 days, the fix is deal inspection and qualification—not another top-of-funnel campaign.
Choose the right forecast methodology mix
Start simple. Weighted forecasts are the right first step for most teams. As data hygiene improves, add bottom-up inspection and then an AI model as a second opinion.
| Method | Complexity | Accuracy | Best use case | Common pitfalls |
|---|---|---|---|---|
| Weighted forecast | Low | Low to medium | Early forecast process, stage-based probability model, fast to implement | Weak stage exit criteria, hard-coded probabilities, poor Salesforce stage discipline, no adjustment over time |
| Bottom-up forecast | Medium to high | High | Weekly manager and rep forecast submissions with roll-up accountability | Missing submissions, poor process governance, inflated rep calls, weak pipeline hygiene |
| AI forecast | High | Medium to high | Second opinion on top of historical snapshots, velocity patterns, and multi-variable deal risk | Poor data hygiene, slow adaptation to process changes, black-box trust issues, high internal support needs |
If you’re building from scratch, the weighted forecast is the winner because it gives you usable structure with the least operational overhead.
A practical weighted example looks like this: Discovery 10%, Demo 20%, Value alignment 35%, Proposal 60%, Negotiation 90%, Closed won 100%. In Salesforce, these probabilities only help if stage definitions are enforced with validation rules or manager inspection.
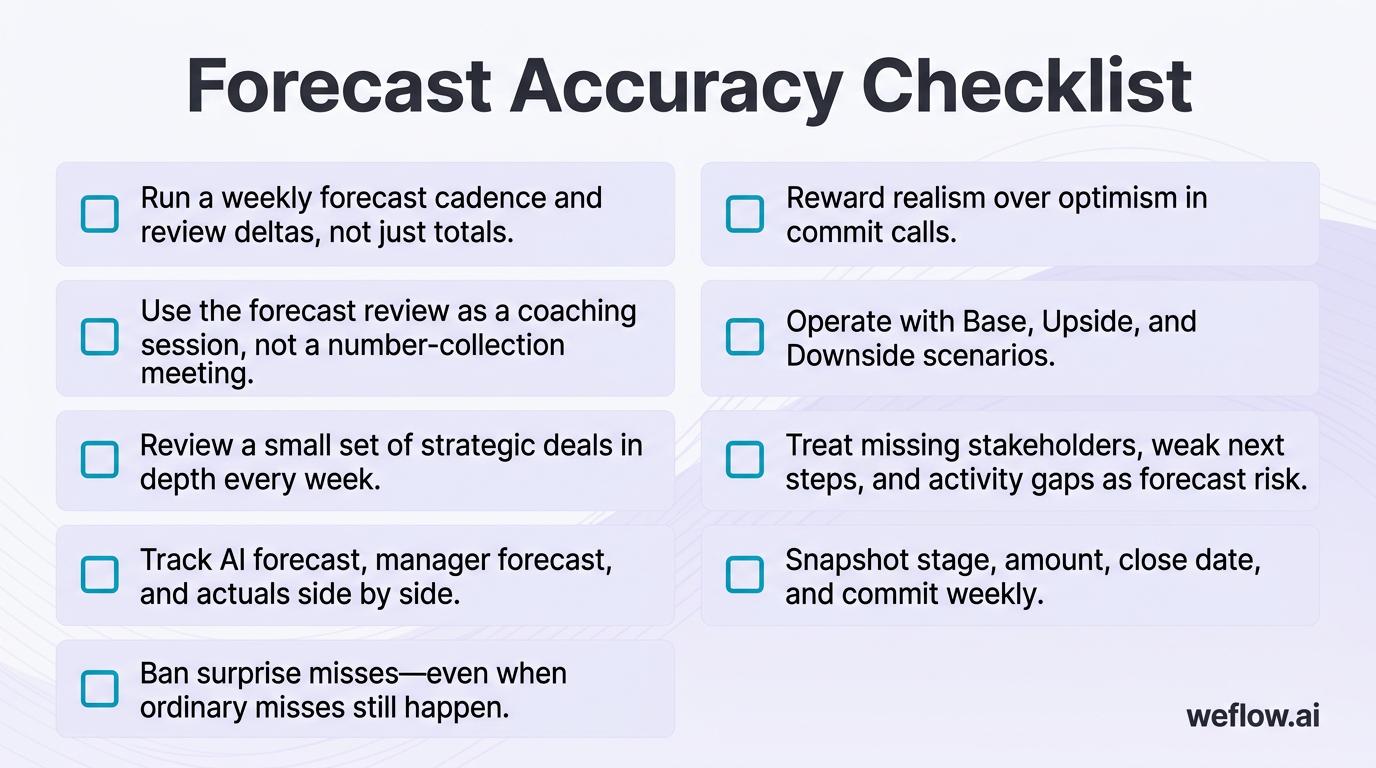
Strengthen forecast accuracy and accountability
- Run a weekly forecast cadence and review deltas, not just totals.
- Use the forecast review as a coaching session, not a number-collection meeting.
- Review a small set of strategic deals in depth every week.
- Track AI forecast, manager forecast, and actuals side by side.
- Ban surprise misses—even when ordinary misses still happen.
- Reward realism over optimism in commit calls.
- Operate with Base, Upside, and Downside scenarios.
- Treat missing stakeholders, weak next steps, and activity gaps as forecast risk.
- Snapshot stage, amount, close date, and commit weekly so you can explain forecast movement with evidence.
This requires a cultural shift. Reps and managers need to feel safe raising deal risk early. If every risk call is treated like failure, the org will hide problems until the last week of the quarter—and forecast accuracy will stay weak no matter how much analytics you add.
Revenue priorities: adapt to AI and complex buying behaviors
AI is now part of the GTM stack, buying groups are larger, and buyers move between self-serve and sales-led paths without warning. But technology doesn’t fix a broken process. Systems should follow process, not the other way around.
Implement AI across the go-to-market funnel
Principles
- Human in the loop: AI should propose actions, score risk, or flag anomalies. Managers and reps should approve high-impact changes.
- Explainability over black box logic: Every score or risk flag should show the top drivers so managers can coach against it.
- Weekly audits: Snapshot key fields and review forecast deltas, slips, and stage changes every week.
- Systems follow process: Define ICP tiers, stage exits, SLAs, and owner rules before you automate anything in Salesforce.
Top of funnel
- ICP scoring and account prioritization
- Intent and signal aggregation
- AI website chat and qualification
- Lead-to-account routing
- Personalized outreach suggestions
- Data enrichment and reply classification
Middle and bottom of funnel
- Discovery coaching and qualification checklist support
- Conversation analysis for objections, competitor mentions, and stakeholder coverage
- Deal risk visibility tied to stage movement, activity gaps, and close-date pushes
- Pricing, legal, and security acceleration support
- Forecasting and analytics as a second opinion on rep calls
Post-sale
- Success plan support at handoff
- Renewal risk scoring
- Product usage signals tied to expansion readiness
- Voice-of-customer and sentiment summaries
- Reference and advocacy mining
Over-automation is the risk to watch. If AI starts updating records, moving stages, or changing ownership without clear approval logic and audit history, Salesforce data integrity usually gets worse, not better.
Realign sales motions to modern buyer behavior
- Redesign stages around approval milestones. “Demo complete” is not a buying milestone. “Economic buyer engaged,” “security review started,” and “budget path confirmed” are better predictors of close likelihood.
- Treat missing stakeholders as forecast risk. For material deals, define the minimum buying group and flag gaps the same way you would flag low pipeline coverage.
- Support multiple buying paths. Some accounts start self-serve, then ask for commercial help. Others want sales assist from the first meeting. Your process should support both.
- Arm champions for the meetings you’re not in. Give them ROI summaries, internal email drafts, business case slides, and approval-ready materials they can reuse.
- Be explicit about where you’ll tolerate slower cycles. Strategic enterprise deals may justify a longer process. Mid-market and self-serve motions usually should not.
In enterprise deals, Legal, Security, and Finance are often the real competitors. They don’t care how strong the demo was. They care whether risk, budget, and procurement concerns are already handled.
Spot signals your process frustrates buyers
Alert: High interest, low movement. You’re getting demos, trials, or POCs, but deals stall once the buying group expands. That usually means your stages measure seller activity, not customer commitment.
Alert: The champion can’t get the deal done internally. If you keep hearing “everyone liked it, but timing wasn’t right,” the issue may be weak internal influence rather than weak product fit. Add stakeholder coverage and internal approval evidence to your inspection process.
Alert: Self-serve and sales fight each other. Prospects move between trial, inbound, and outbound with different pricing, different owners, and different messages. This usually points to unclear segmentation, poor routing logic, or channel conflict.
Alert: Win stories contradict the official playbook. If closed-won deals regularly start product-led, close through executive alignment, or require late-stage legal help that your stage model ignores, your process is behind actual buyer behavior.
A fast audit helps here. Pull the last 20 closed-won opportunities, review stakeholder history, stage duration, activity completeness, and approval milestones in Salesforce, then compare the real path to your documented sales process. The gaps are usually obvious.
Revenue execution: turn metric tracking into predictable growth
Metrics matter only when they change behavior. A CRO can track Rule of 40, NRR, win rate, and forecast error all day, but predictability comes from process discipline: clean data, clear stage exits, honest pipeline inspection, and weekly decisions tied to what the numbers show.
Don’t try to redesign the whole revenue engine in one pass. Start with one bottleneck—usually pipeline coverage, win rate, or forecast accuracy—then fix the operating inputs behind it. If you want a quick place to start this week, audit current-quarter and next-quarter pipeline coverage, compare it to win rates by segment, and check whether Salesforce activity data is complete enough to trust the result.
If you’re using the cheat sheet as a working document, use it that way: pick the metrics your board cares about, map each one to a manager dashboard, and make sure every number has an owner, a review cadence, and a defined action when it moves in the wrong direction.
FAQ
What is the Rule of 40 for SaaS revenue growth?
The Rule of 40 is the sum of your year-over-year revenue growth rate and EBITDA margin. The target is above 40%, with 40%-60% considered good and above 60% considered excellent because it shows you’re balancing growth and profitability instead of over-indexing on one.
How do you calculate CAC payback period?
CAC payback period is calculated as CAC / (ARPA × Gross Margin). Best-in-class SaaS companies aim for under 12 months, while typical ranges are 6-12 months for SMB, 12-18 months for mid-market, and 18-24 months for enterprise.
What is a healthy net dollar retention rate?
Net Dollar Retention, often used interchangeably with Net Revenue Retention, measures how much revenue you keep and expand from existing customers after churn and contraction. A healthy benchmark depends on segment: 90%-100% for SMB, 100%-110% for mid-market, and above 120% for enterprise, with above 130% standing out as top-tier performance.
How should a CRO structure the revenue team?
The cleanest model places Marketing, Sales, Customer Success, and RevOps under the CRO so one leader owns the full customer journey from pipeline generation through renewal and expansion. RevOps should report as a peer function because it owns Salesforce process design, reporting logic, field mapping, and operating cadence across all revenue teams.
What is the difference between GRR and NRR?
GRR measures how much recurring revenue you keep from existing customers before expansion, so it tops out at 100%. NRR includes upsell and cross-sell, which is why strong SaaS companies target above 100%, great companies reach above 110%, and best-in-class enterprise businesses often exceed 120%.


.webp)
.webp)
.avif)